HIV Project Summary Sheet and Figures
HIV Project Summary Sheet and Figures include data on HIV prevalence by age and sex, viral load suppression among people living with HIV, achievement of the 90-90-90 goals, and more. The project is supported by the U.S. President's Emergency Plan for AIDS Relief (PEPFAR) through the CDC. Findings and conclusions in the report provide insights into HIV statistics from 2016-2017.

Download Presentation

Please find below an Image/Link to download the presentation.
The content on the website is provided AS IS for your information and personal use only. It may not be sold, licensed, or shared on other websites without obtaining consent from the author.If you encounter any issues during the download, it is possible that the publisher has removed the file from their server.
You are allowed to download the files provided on this website for personal or commercial use, subject to the condition that they are used lawfully. All files are the property of their respective owners.
The content on the website is provided AS IS for your information and personal use only. It may not be sold, licensed, or shared on other websites without obtaining consent from the author.
E N D
Presentation Transcript
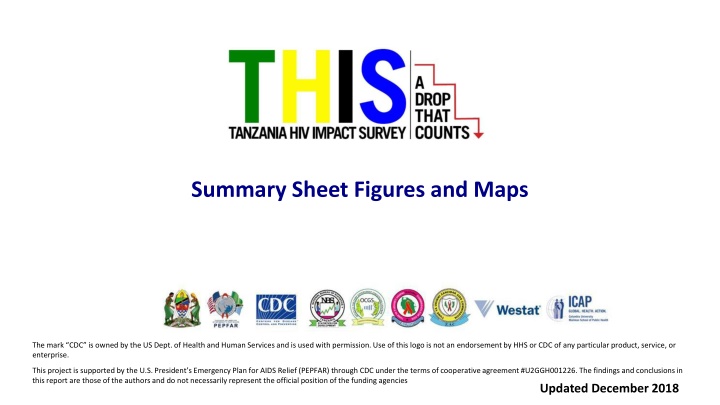
Summary Sheet Figures and Maps The mark CDC is owned by the US Dept. of Health and Human Services and is used with permission. Use of this logo is not an endorsement by HHS or CDC of any particular product, service, or enterprise. This project is supported by the U.S. President s Emergency Plan for AIDS Relief (PEPFAR) through CDC under the terms of cooperative agreement #U2GGH001226. The findings and conclusions in this report are those of the authors and do not necessarily represent the official position of the funding agencies Updated December 2018
HIV Prevalence by Age and Sex, THIS 2016-2017 Error bars represent 95% confidence intervals.
HIV Prevalence Among Adults 15+, by Region, THIS 2016-2017 * Indicates zero cases
Viral Load Suppression Among People Living with HIV, by Age and Sex, THIS 2016-2017 Error bars represent 95% confidence intervals.
Viral Load Suppression Among People Living with HIV, Aged 15+, by Region, THIS 2016-2017 * Indicates that estimate is based on <25 observations and should be interpreted with caution; estimates in parentheses are based on 25-49 observations and should also be interpreted with caution; a cross ( ) indicates that the region had no HIV positive samples with which to estimate viral load suppression.
Achievement of the 90-90-90 Goals Among HIV-Positive Adults, by Sex, THIS 2016-2017 Error bars represent 95% confidence intervals. *Inset numbers are conditional proportions. Diagnosed: awareness was defined as self-reporting HIV positive and/ or having a detectable antiretroviral (ARV) in the blood. On Treatment: being on ART was defined as self-reporting current use of ART and/or having a detectable ARV in the blood.
Find the THIS Summary Sheet and additional PHIA Project results at: phia.icap.columbia.edu The mark CDC is owned by the US Dept. of Health and Human Services and is used with permission. Use of this logo is not an endorsement by HHS or CDC of any particular product, service, or enterprise. This project is supported by the U.S. President s Emergency Plan for AIDS Relief (PEPFAR) through CDC under the terms of cooperative agreement #U2GGH001226. The findings and conclusions in this report are those of the authors and do not necessarily represent the official position of the funding agencies