HIV Data and Analysis Summary

This project is supported by the U.S. President’s Emergency Plan for AIDS Relief (PEPFAR) through CDC under the terms of cooperative agreement #U2GGH001226. The findings and conclusions in
this report are those of the authors and do not necessarily represent the official position of the funding agencies
The mark “CDC” is owned by the US Dept. of Health and Human Services and is used with permission. Use of this logo is not an endorsement by HHS or CDC of any particular product, service, or
enterprise.
Summary Sheet Figures and Maps
Updated July 2018
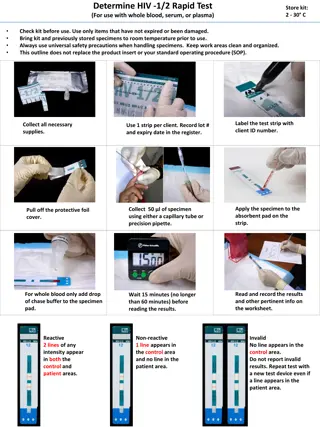
HIV Prevalence by Age and Sex, CIPHIA 2017-2018
Error bars represent 95% confidence intervals.
HIV prevalence refers to prevalence of HIV-1 and HIV-2
HIV prevalence refers to prevalence of HIV-1 and HIV-2
HIV Prevalence Among Adults,
by Region, CIPHIA 2017-2018
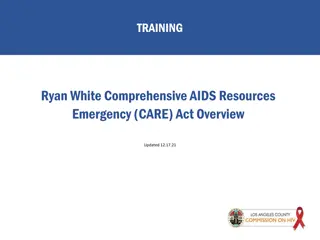
Viral Load Suppression Among HIV-Positive People, by Age and Sex,
CIPHIA 2017-2018
Estimates for males ages 15-24 and 25-34 are based on a very small number (less than 25) unweighted cases and have been suppressed. Estimates in parentheses are based on a
small number of unweighted cases (25-49) and should be interpreted with caution. Viral load suppression is among only those people living with HIV-1 or HIV-1/2.
Error bars represent 95% confidence intervals.
Viral Load Suppression Among HIV-Positive Adults, by Region, CIPHIA
2017-2018
Achievement of the 90-90-90 Goals Among HIV-Positive Adults, by Sex,
CIPHIA 2017-2018
Error bars represent 95% confidence intervals.
Estimates in parentheses are based on a small number
of unweighted cases (25-49) and should be
interpreted with caution. Inset numbers are
conditional proportions. See text above. 90-90-90 is
among only those people living with HIV-1 or HIV-1/2.
Diagnosed:
awareness was defined as self-reporting HIV positive and/
or having a detectable antiretroviral (ARV) in the blood.
On Treatment:
being on ART was defined as self-reporting current use
of ART and/or having a detectable ARV in the blood.
Find the CIPHIA Summary Sheet
and additional PHIA Project results at:
phia.icap.columbia.edu
This project is supported by the U.S. President’s Emergency Plan for AIDS Relief (PEPFAR) through CDC under the terms of cooperative agreement #U2GGH001226. The findings and
conclusions in this report are those of the authors and do not necessarily represent the official position of the funding agencies
The mark “CDC” is owned by the US Dept. of Health and Human Services and is used with permission. Use of this logo is not an endorsement by HHS or CDC of any particular
product, service, or enterprise.
Ministry of Health and Public Hygiene, Cote d’Ivoire, Centers for Disease Control and Prevention (CDC), and ICAP at Columbia University. Cote d’Ivoire Population-based HIV Impact Assessment (CIPHIA) 2015-16: Summary Sheet. Abidjan, Cote d’Ivoire, Atlanta, Georgia and New York, New York, USA: Ministry of Health, CDC and ICAP. July 2018.
This collection of images presents key findings from the CIPHIA project on HIV prevalence, viral load suppression, and achievement of the 90-90-90 goals among adults. The data covers various demographic factors and regional breakdowns for a comprehensive overview of the HIV landscape.

Download Presentation

Please find below an Image/Link to download the presentation.
The content on the website is provided AS IS for your information and personal use only. It may not be sold, licensed, or shared on other websites without obtaining consent from the author.If you encounter any issues during the download, it is possible that the publisher has removed the file from their server.
You are allowed to download the files provided on this website for personal or commercial use, subject to the condition that they are used lawfully. All files are the property of their respective owners.
The content on the website is provided AS IS for your information and personal use only. It may not be sold, licensed, or shared on other websites without obtaining consent from the author.
E N D
Presentation Transcript
Summary Sheet Figures and Maps The mark CDC is owned by the US Dept. of Health and Human Services and is used with permission. Use of this logo is not an endorsement by HHS or CDC of any particular product, service, or enterprise. This project is supported by the U.S. President s Emergency Plan for AIDS Relief (PEPFAR) through CDC under the terms of cooperative agreement #U2GGH001226. The findings and conclusions in this report are those of the authors and do not necessarily represent the official position of the funding agencies Updated July 2018
HIV Prevalence by Age and Sex, CIPHIA 2017-2018 Error bars represent 95% confidence intervals. HIV prevalence refers to prevalence of HIV-1 and HIV-2
HIV Prevalence Among Adults, by Region, CIPHIA 2017-2018 HIV prevalence refers to prevalence of HIV-1 and HIV-2
Viral Load Suppression Among HIV-Positive People, by Age and Sex, CIPHIA 2017-2018 Estimates for males ages 15-24 and 25-34 are based on a very small number (less than 25) unweighted cases and have been suppressed. Estimates in parentheses are based on a small number of unweighted cases (25-49) and should be interpreted with caution. Viral load suppression is among only those people living with HIV-1 or HIV-1/2. Error bars represent 95% confidence intervals.
Viral Load Suppression Among HIV-Positive Adults, by Region, CIPHIA 2017-2018
Achievement of the 90-90-90 Goals Among HIV-Positive Adults, by Sex, CIPHIA 2017-2018 Error bars represent 95% confidence intervals. Estimates in parentheses are based on a small number of unweighted cases (25-49) and should be interpreted with caution. Inset numbers are conditional proportions. See text above. 90-90-90 is among only those people living with HIV-1 or HIV-1/2. Diagnosed: awareness was defined as self-reporting HIV positive and/ or having a detectable antiretroviral (ARV) in the blood. On Treatment: being on ART was defined as self-reporting current use of ART and/or having a detectable ARV in the blood.
Find the CIPHIA Summary Sheet and additional PHIA Project results at: phia.icap.columbia.edu The mark CDC is owned by the US Dept. of Health and Human Services and is used with permission. Use of this logo is not an endorsement by HHS or CDC of any particular product, service, or enterprise. This project is supported by the U.S. President s Emergency Plan for AIDS Relief (PEPFAR) through CDC under the terms of cooperative agreement #U2GGH001226. The findings and conclusions in this report are those of the authors and do not necessarily represent the official position of the funding agencies