Histograms and Uncertainty in Particle Physics
Learn how particle physicists use histograms to discover new particles and measure particle characteristics. Explore activities on constructing histograms, determining the best data representation, and reporting uncertainty in answers. Enhance your skills in data analysis with practical examples like rolling dice and measuring particle angles in collisions.

Uploaded on | 0 Views
Download Presentation

Please find below an Image/Link to download the presentation.
The content on the website is provided AS IS for your information and personal use only. It may not be sold, licensed, or shared on other websites without obtaining consent from the author. If you encounter any issues during the download, it is possible that the publisher has removed the file from their server.
You are allowed to download the files provided on this website for personal or commercial use, subject to the condition that they are used lawfully. All files are the property of their respective owners.
The content on the website is provided AS IS for your information and personal use only. It may not be sold, licensed, or shared on other websites without obtaining consent from the author.
E N D
Presentation Transcript
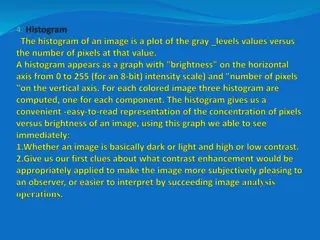
INTRODUCTION Particle physicists rely on histograms to find new particles and to measure the characteristics of particles. Sometimes the probability of a particular interaction occurring is small. In such cases, particle physicists collect huge amounts of data in the hope of finding this interaction as a small bump in the histogram. This activity builds histogram skills required in many of the other activities in the Data Activities Portfolio. In this activity, students will construct histograms, identify the best value to represent the data, and report the uncertainty in their answers.
LEARNING OBJECTIVES Students will know and be able to: Determine the uncertainty for a particular bin. Determine the best value to represent the data. Determine the uncertainty in the best value to represent the data.
Part 1- Rolling of dice Part 2- Measuring the angle phi ( ) at which muons emerge after collisions in ATLAS. Part 3- Defining uncertainty for a Gaussian distribution.
Part 1-Rolling of Dice The student pages present the following histograms and ask questions to lead them to see that there is no preferred number when rolling a six-sided die. Also, they should notice that each set of 100 rolls yields a different result, but if the number of rolls is large, then there seems to be no preferred number. When all of the sides have equal probability of being rolled, then the die is said to be a fair die.
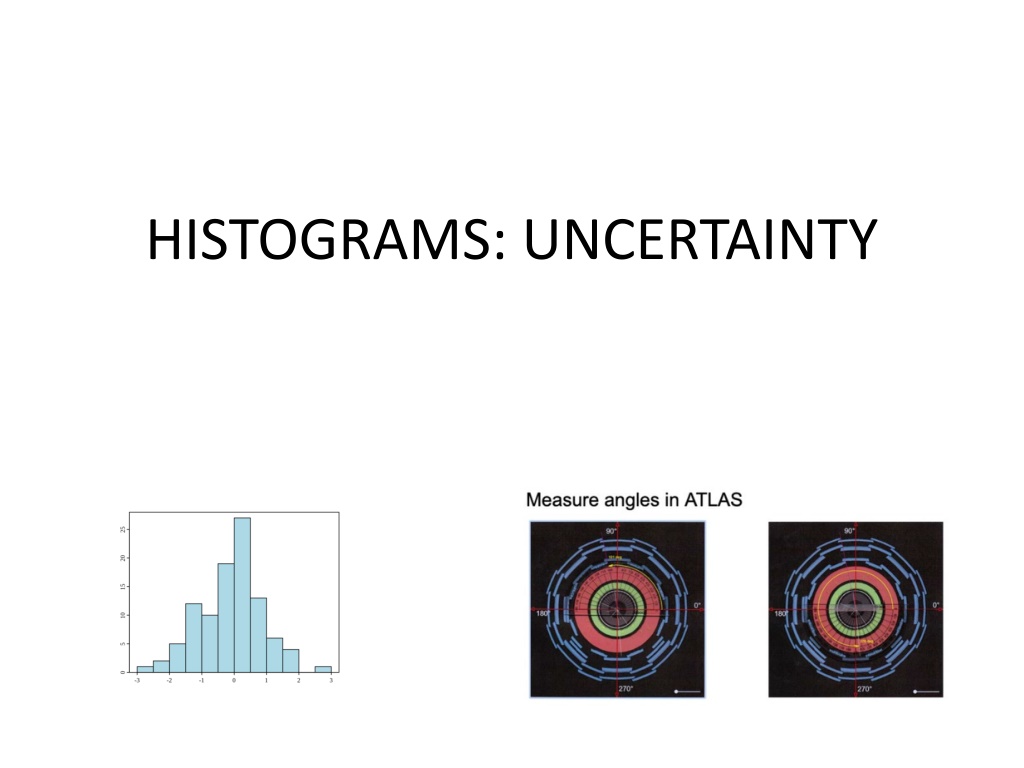
Part 2 ATLAS Measuring the ANGLE phi ( ) Muons emerge at a particle angle phi ( ) after collision events inside the ATLAS detector. The physicists wanted to see if there was a preferred angle for the muons to emerge from a collision. The angle phi ( ) is measured around the LHC beam pipe which is the direction of motion for the incoming particles. Figure 1 shows how to measure the angle.
Part 2 ATLAS Measuring the Angle phi ( )
Part 2 ATLAS Measuring the ANGLE phi ( )
Part 3: Defining uncertainty for a Gaussian distribution. In a Gaussian (or normal) distribution, the data values can be less than or greater than the mean. Figure 3 below shows the shape of a typical Gaussian distribution. The standard deviation in the Gaussian distribution is approximated by finding the width of the Gaussian when the frequency is half of the maximum value and dividing by 2 (Full-Width Half-Maximum over 2, or FWHM/2).
The uncertainty for each bin is found by using the standard deviation Poisson distribution N. The uncertainty of the histogram is found using the approximation of the standard deviation of the Gaussian distribution FWHM/2.
Three Histograms for Assessment Student Instructions: For Histogram 1: Calculate the uncertainty of each bin. Draw the error bars on each bin. For Histograms 2 and 3: Calculate the uncertainty of each bin. Draw the error bars on each bin. Determine the uncertainty of the peak using FWHM. Make a claim about the most likely particle mass in GeV including uncertainty. Support your claim with evidence and reasoning.