Graph Shapes and Descriptors

What Shape Is My Graph?

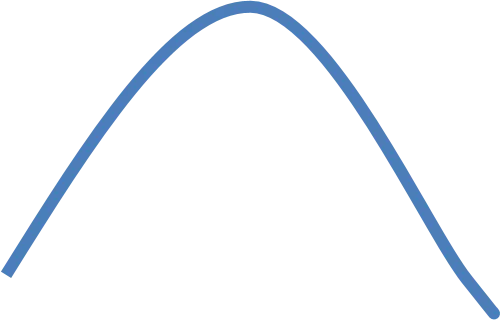
How many bumps does it have?
•
Unimodal (1)
•
Bimodal (2)
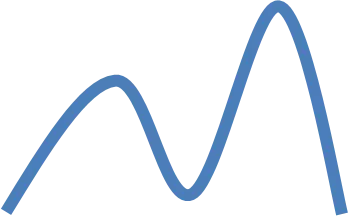


These “modes”
should be very
noticeable. We are
not interested in
every tiny little
change. Look for the
overall pattern.
CAUTION:
This descriptor alone
(unimodal/bimodal) is
usually not enough. It is
an additional descriptor
used with symmetric
graphs. Occasionally
bimodal
can be used
alone but not
unimodal.
Shapes
•
Symmetric
•
Skewed Left
•
Skewed Right
•
Uniform
For skewed graphs
the direction
corresponds to the
location of the
TAIL
.
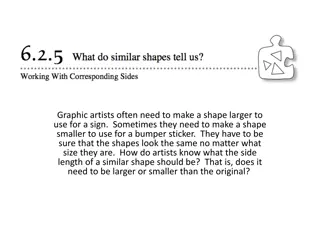
When describing the shape
•
It is okay to use “ly” words! The graph doesn’t
have to match the shape perfectly.
•
Roughly symmetric
•
Approximately uniform
•
Your goal is to describe what you see as best
as you can.
What Shape?
Very few people die young
Many people live a long life
The x-axis shows age from 0-
100ish years.
What Shape?
This graph comes up
a lot so know that it
has this shape. Also,
variables that are
related to income will
have this skewed
right shape.
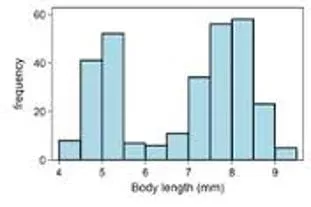
What Shape?
•
Consider a data set containing IQ scores for the general public.
What shape would you expect a histogram of this data to have?
•
Symmetric
Skewed to the right
•
Skewed to the left
Bimodal
•
Symmetric
•
Consider a data set of the scores on a very easy exam in which most
score very well but a few score very poorly. What shape would you
expect a histogram of this data to have?
•
Symmetric
Skewed to the right
•
Skewed to the left
Bimodal
Your Turn!
•
On your paper, write down the name for the
graph shown based on shape.
•
When describing a graph as Symmetric, you
should include whether it is unimodal or
bimodal.
Answers
•
Symmetric, unimodal
•
Uniform
•
Skewed Right
•
Skewed Left
•
Skewed Right
•
Approximately uniform
•
Females – roughly symmetric; Males – skewed
right
•
Skewed right
•
Fairly symmetric and unimodal
•
Bimodal
Learn how to identify different graph shapes such as symmetric, skewed, and uniform, and understand descriptors like unimodal and bimodal. Explore practical examples and visual aids to enhance your graph interpretation skills.

Download Presentation

Please find below an Image/Link to download the presentation.
The content on the website is provided AS IS for your information and personal use only. It may not be sold, licensed, or shared on other websites without obtaining consent from the author.If you encounter any issues during the download, it is possible that the publisher has removed the file from their server.
You are allowed to download the files provided on this website for personal or commercial use, subject to the condition that they are used lawfully. All files are the property of their respective owners.
The content on the website is provided AS IS for your information and personal use only. It may not be sold, licensed, or shared on other websites without obtaining consent from the author.
E N D
Presentation Transcript
How many bumps does it have? Unimodal (1) Bimodal (2) These modes should be very noticeable. We are not interested in every tiny little change. Look for the overall pattern. CAUTION: This descriptor alone (unimodal/bimodal) is usually not enough. It is an additional descriptor used with symmetric graphs. Occasionally bimodal can be used alone but not unimodal.
Shapes Symmetric Skewed Left For skewed graphs the direction corresponds to the location of the TAIL. Skewed Right Uniform
When describing the shape It is okay to use ly words! The graph doesn t have to match the shape perfectly. Roughly symmetric Approximately uniform Your goal is to describe what you see as best as you can.
What Shape? Very few people die young Many people live a long life The x-axis shows age from 0- 100ish years.
What Shape? This graph comes up a lot so know that it has this shape. Also, variables that are related to income will have this skewed right shape.
What Shape? Consider a data set containing IQ scores for the general public. What shape would you expect a histogram of this data to have? Symmetric Skewed to the right Skewed to the left Bimodal Symmetric Consider a data set of the scores on a very easy exam in which most score very well but a few score very poorly. What shape would you expect a histogram of this data to have? Symmetric Skewed to the right Skewed to the left Bimodal
Your Turn! On your paper, write down the name for the graph shown based on shape. When describing a graph as Symmetric, you should include whether it is unimodal or bimodal.
Answers Symmetric, unimodal Uniform Skewed Right Skewed Left Skewed Right Approximately uniform Females roughly symmetric; Males skewed right Skewed right Fairly symmetric and unimodal Bimodal