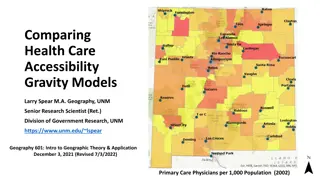
Geographic Accessibility in Health Care Planning
Accessibility to health care services is crucial for populations. Geographic accessibility, enabled by Geographic Information Systems (GIS), plays a vital role in identifying service catchment areas and enhancing health care planning. This research focuses on measuring geographic accessibility in Taiwan using GIS tools to evaluate the risk and plan against pandemic influenza.

Download Presentation

Please find below an Image/Link to download the presentation.
The content on the website is provided AS IS for your information and personal use only. It may not be sold, licensed, or shared on other websites without obtaining consent from the author.If you encounter any issues during the download, it is possible that the publisher has removed the file from their server.
You are allowed to download the files provided on this website for personal or commercial use, subject to the condition that they are used lawfully. All files are the property of their respective owners.
The content on the website is provided AS IS for your information and personal use only. It may not be sold, licensed, or shared on other websites without obtaining consent from the author.
E N D
Presentation Transcript
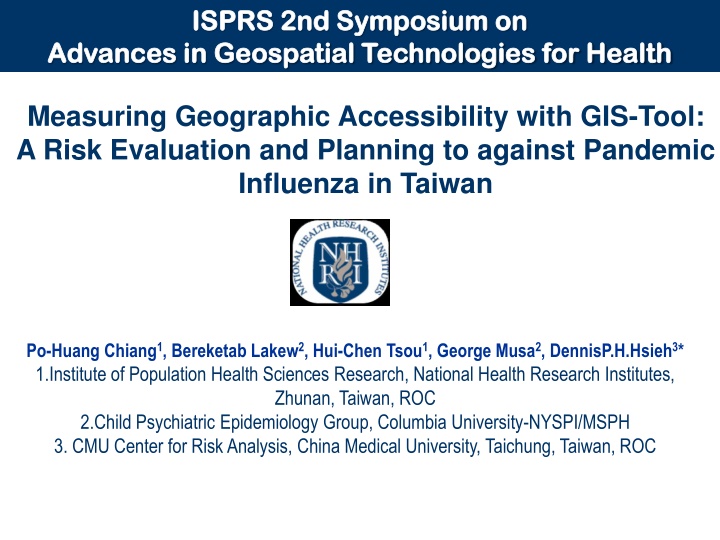
ISPRS 2nd Symposium on ISPRS 2nd Symposium on Advances in Geospatial Technologies for Health Advances in Geospatial Technologies for Health Measuring Geographic Accessibility with GIS-Tool: A Risk Evaluation and Planning to against Pandemic Influenza in Taiwan Po-Huang Chiang1, Bereketab Lakew2, Hui-Chen Tsou1, George Musa2, DennisP.H.Hsieh3* 1.Institute of Population Health Sciences Research, National Health Research Institutes, Zhunan, Taiwan, ROC 2.Child Psychiatric Epidemiology Group, Columbia University-NYSPI/MSPH 3. CMU Center for Risk Analysis, China Medical University, Taichung, Taiwan, ROC
Introduction Accessibility to health care is concerned with the ability of a population to obtain a specified set of health care services. In this context, geographic accessibility often referred to as spatial or physical accessibility is concerned with the complex relationship which exists between the spatial separation of the population and the supply of health care facilities. The use of Geographic Information Systems (GIS) for the measurement of physical accessibility is well established and has been applied in many areas including retail site analysis, transport, emergency service and health care planning (e.g. Wilkinson et al 1998, Albert et al 2000 and Cromley & McLafferty 2002). In the context of health care planning, the ability of GIS to identify the geographic extent of a health facility catchment area, which corresponds to the area which contains the population utilizing this facility, is a particularly important analytical capability.
Methods GIS data used in this research are in both Vector and Raster data formats: Health facilities Road River Vector Data Population Land use Digital Terrain Model Raster Data
Methods 1. Modified Human Population Maps: Step 1. Compute the potential population Miaoli County is located at the north-central part of Taiwan and consider to be a rural county. In order to construct the correlation between different land-cover types and population distribution in this rural area, we compute the potential population. Its basic assumption is that population distribution would be in proportion to the land-cover types and they also would be inversely proportional to the distance of all land-cover types centers. In this paper, we divided land-cover into three parts, urban, rural and woodland, then, applied the IDW (Inverse Distance Weighted, IDW) technology to interpolate the land-cover types. Figure 2.
Methods Figure 2
Methods Step 2. Construct a regression model We tested the correlation between potential population and the census survey data by using simple regression. Figure 3 Figure 3
Methods Step 3.Modification from slope Most of the terrains of Miaoli County are mountain regions and wilds. To modify the virtual population distribution, we took the terrains into account. According to the constructing rules in Taiwan, house can t be build in the places where the slope more than 30 degrees. We took the slope as reference and modified the population distribution located at places more than 30 degrees. Figure 4 shows the Miaoli County Terrains and Figure 5 shows that the area where slop is greater than 30 degrees.
Methods Figure 4 Miaoli County Terrains
Methods Greater than and less than 30 degrees Slope Slope Figure 5
Methods Figure 6
Methods 2. Health Risk Management: Utilizing AccessMod developed by WHO, we combined the vector data and grid data of hospital facilities, health manpower, transportation patters, distance and time to manage health risk of pandemic flu.
Results Using the Characters of GIS technology in health risk management and decision is an useful method. In Figure 8 showed that the non-accessibility area can be scale-up and simulated how many and what kinds of health facilities were needed. The policy recommendations will be followed the simulated results.
Discussions Access to health care is an important component of an overall health system which has a direct impact on the burden of disease that affects many countries in the developing world. Measuring accessibility to health care therefore contributes to a wider understanding of the performance of health systems within and between countries which facilitates the development of evidence based health policies. In view of the growing human health concern as the pandemic flu and occurrence of severe influenza outbreaks spread the entire world, a timely active health risk management preparation will be crucial to disease prevention. This paper illustrates the integration of GIS with modified population distribution methods and simulation technology onto the analysis of hospital accessibility of pandemic flu preparation, enables local government to predict both the capability and population at risk area when face to the disease.
Reference 1. Albert, D.P., Gesler, W.M. & Horner, R.D. 2000, 'Geographic Information Systems in Health Services Research', In D.P. 2. Cromley, E.K. & McLafferty, S.L. 2002, 'Analyzing Access to Health Services', GIS and Public Health, Guilford Press,New York. 3. Maantay JA, Maroko AR, Herrmann C. Mapping population distribution in the urban environment: The cadastral-based expert dasymetric system (CEDS). CaGIS 2007;34(2):77-102. 4. Ray N, Ebener S. AccessMod 3.0: Computing geographic coverage and accessibility to health care services using anisotropic movement of patients. Int J Health Geogr 2008;7:63. 5. Wilkinson, P., Grundy, C., Landon, M. & Stevenson, S. 1998, 'GIS and Health', In A. Gatrell & M. Loytonen (eds) GIS and Health, Taylor & Francis, London