Genetic Architecture of Smoking Behavior Traits: Meta-Analysis Insights
Exploring the genetic basis of smoking behavior-related traits through a meta-analysis combining data from three large consortia across 58 different cohorts/datasets. The study investigates genetic variants associated with cigarettes per day, pack years, smoking initiation, and smoking cessation. Overview of genetic epidemiology terminology, SNP analysis, and genome-wide association studies for understanding the role of genetic factors in smoking behaviors.
Download Presentation

Please find below an Image/Link to download the presentation.
The content on the website is provided AS IS for your information and personal use only. It may not be sold, licensed, or shared on other websites without obtaining consent from the author.If you encounter any issues during the download, it is possible that the publisher has removed the file from their server.
You are allowed to download the files provided on this website for personal or commercial use, subject to the condition that they are used lawfully. All files are the property of their respective owners.
The content on the website is provided AS IS for your information and personal use only. It may not be sold, licensed, or shared on other websites without obtaining consent from the author.
E N D
Presentation Transcript
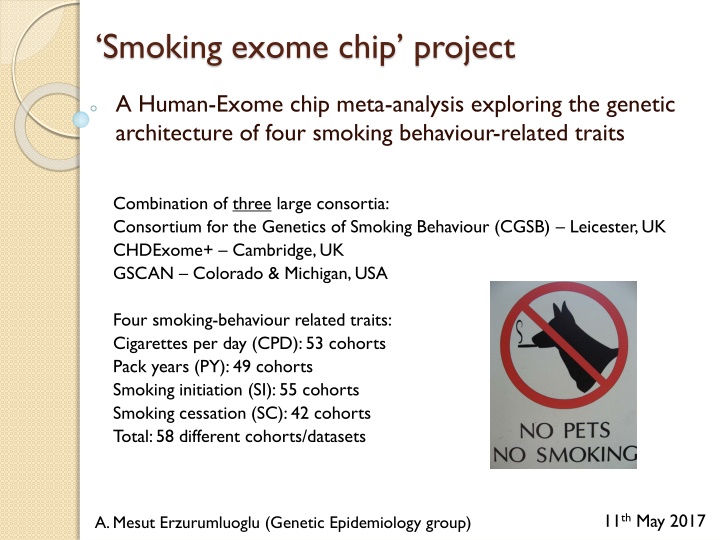
Smoking exome chip project A Human-Exome chip meta-analysis exploring the genetic architecture of four smoking behaviour-related traits Combination of three large consortia: Consortium for the Genetics of Smoking Behaviour (CGSB) Leicester, UK CHDExome+ Cambridge, UK GSCAN Colorado & Michigan, USA Four smoking-behaviour related traits: Cigarettes per day (CPD): 53 cohorts Pack years (PY): 49 cohorts Smoking initiation (SI): 55 cohorts Smoking cessation (SC): 42 cohorts Total: 58 different cohorts/datasets 11th May 2017 A. Mesut Erzurumluoglu (Genetic Epidemiology group)
Contents Intro to Genetic Epidemiology (GE) terminology Slides 3-10 Intro to Smoking and genetic association studies on Smoking behaviour related traits Slides 11-13 Smoking exome chip project Current sample sizes slide 14 Quality control steps slides 15-20 Results and follow-up studies slides 21-28 Next steps slide 29 2
Our genome 3 billion base-pairs long Made up of Adenine (A), Guanine (G), Cytosine (C) & Thymine (T) Inherit a copy each from our parents 99.9% similar Some differences (variants) are widespread in the population Base pairs Sugar backbone 3
GE terminology SNP Single nucleotide polymorphism: Single base change in a specific position of the genome where different individuals (in a certain population) have different alleles (i.e. polymorphic) and therefore different genotypes Alleles SNP A A A G G G T T T T T T AA AG GG Genotypes GE: Genetic Epidemiology 4
GE terminology Association study A A A G G G AA AG Smokes GG Does not smoke Smokes a lot Is SNP (or genotype) associated with disease/trait? Analyse (hundreds of thousands) SNPs from across the genome, in a large number of individuals (usually tens of thousands) = genome-wide association study (GWAS) SNPs identified through GWASs may improve our biological understanding of disease with ultimate aim of prevention, improvement in diagnostics and treatment (e.g. drug targets) 5
GE terminology Rare/Common? Rare SNP: variant with minor allele frequency<1% Genotypes for 100 individuals at SNP 2 Genotypes for 100 individuals at SNP 1 A/A A/A A/GA/A A/A A/A A/A A/G G/GA/A A/GA/A A/GA/A A/GA/A A/GA/A A/A A/A A/A A/GA/GA/G A/A A/A A/GA/A A/A A/GA/A A/GA/A A/A A/GA/A A/A A/A A/A A/A A/A A/G G/GA/A A/A A/A A/GA/A A/GA/A A/A A/A A/GA/A A/A A/A A/A A/G G/GA/A A/GA/A A/GA/A A/GA/A A/GA/A A/A A/A A/A A/G A/GA/GA/A A/A A/GA/A A/A A/GA/A A/GA/A A/A A/GA/A A/A A/A A/A A/A A/A A/G G/GA/A A/A A/A A/GA/A A/GA/A C/C C/C C/T C/C C/C C/C C/C C/C C/C C/C C/C C/C C/C C/C C/C C/C C/C C/C C/C C/C C/C C/C C/C C/C C/C C/C C/C C/C C/C C/C C/C C/C C/C C/C C/C C/C C/C C/C C/C C/C C/C C/C C/C C/C C/C C/C C/C C/C C/C C/C C/C C/C C/C C/C C/C C/C C/C C/C C/C C/C C/C C/C C/C C/C C/C C/C C/C C/C C/C C/C C/C C/C C/C C/C C/C C/C C/C C/C C/C C/C C/C C/C C/C C/C C/C C/C C/C C/C C/C C/C C/C C/C C/C C/C C/C C/C C/C C/C C/C C/C Genotype counts: C/C=99, C/T=1, T/T=0 Minor allele = T Minor allele count (MAC) = 2*0 (T/T) + 1 (C/T) = 1 Minor allele frequency (MAF) = MAC / (2 chr 100 indiv) = 1 / 200 = 0.5% T allele at SNP 2 is a Rare variant (<1%) Genotype counts: A/A=64, A/G=32, G/G=4 Minor allele = G Minor allele count (MAC) = 2*4 (G/G) + 32 (A/G) = 40 Minor allele frequency (MAF) = MAC / (2 chr 100 indiv) = 40 / 200 = 20% G allele at SNP 1 is a Common variant (>1%) 6
Human-Exome chip Genome: complete set of DNA we receive from our parents Exome: subset of the genome formed by exons (~1%) see image below (filled in orange) Genotyping arrays are often called a chip as they resemble a computer chip Not for DNA sequencing, but genotyping certain alleles Human-Exome chip is designed to predominantly harbour rare putatively functional variants thus much larger sample sizes needed ~250,000 variants (in up to 286,425 individuals in our project) UK Biobank Axiom array, designed mostly for GWAS (MAF>1%) purposes ~820,000 variants (in a subset of the total, up to 112,811 individuals in our project) Gene Exon 1 Exon 2 Exon 3 Image from Ensembl VEP 7
Genetic association study Linear regression model: trait ~ SNP + covs + e Covariates: Age, sex and principal components ( 3, up to 10 PCs) Significance threshold: P<5x10⁻⁷ for Human-Exome chip variants and P<5x10⁻⁸ for GWAS chip variants Quality control (QC) parameters At study-level: Hardy-Weinberg equilibrium p-value threshold of 10-5 and call rate threshold of >95% for each genotyped SNP To identify poor quality SNPs and genotyping errors At meta-analysis level: we excluded datasets where the effects sizes were non-normally distributed and/or the genomic inflation factor ( ) was very low (<0.80) Deflated can occur due to phenotypically discordant samples Call rate Fraction of called SNPs per sample over the total number of SNPs in the dataset 8
Additive model Additive model assumes: Trait value/risk no of risk alleles inherited Value Quantitative trait e.g. height 0/0 0/1 1/1 Genotype (risk allele coded as 1) : effect size 9
Meta-analysis of GWAS Analysis plan developed (instructions for trait-specific association studies) Study 1 Study 6 Study 2 Study 5 Study 3 Study 4 RESULTS in RAREMETALWORKER output format Meta-analysis using RAREMETAL Associated SNPs GWAS: Genome-wide association studies 10
Introduction to Smoking Smoking is a major risk factor for many diseases, including many common diseases e.g. lung cancer and chronic obstructive pulmonary disease (COPD) It is thought to be the cause of 1 in 10 deaths worldwide Thus, there is a special interest in understanding the genetic aetiology of smoking behaviour and whether certain individuals are more likely to start or stop smoking or smoke heavily after starting References: - Wain LV et al. 2017. Genome-wide association analyses for lung function and chronic obstructive pulmonary disease identify new loci and potential druggable targets. Nature genetics;49(3): 416-425 - Reitsma et al. 2017. Smoking prevalence and attributable disease burden in 195 countries and territories, 1990-2015: a systematic analysis from the Global Burden of Disease Study 2015. The Lancet. 11
Traits analysed Smoking behaviour related traits Smoking initiation (SI, binary trait) Ever vs Never smokers. Ever smokers were defined as individuals who have smoked >99 cigarettes in their lifetime. Smoking cessation (SC, binary trait) Ex vs Current Smokers Cigarettes per day (CPD, quantitative trait) Inverse-normalised Pack years (PY, quantitative trait) Packs per day x Years smoked, inverse-normalised 12
Previous studies Previous GWASs have been successful in identifying 13 common SNPs associated with smoking behaviour related traits Including the 15q25 (CHRNA3) region, which yield the largest effects (explaining ~1% of phenotypic variance) However the identified loci explain only a small amount of the estimated genetic heritability of smoking behaviour (between 2% and 3%), which is thought to be around 40-60% Thus there is a need for alternative approaches to elucidate further the genetic architecture of smoking behaviour CHRN: Cholinergic receptor nicotinic 13
Current sample sizes SI: n=286,425 (UK Biobank + UK BiLEVE n=112,811) CGSB Cohort AIRWAVE ASCOT SC ASCOT UK B58C BRIGHT DIABNORD EFSOCH EGCUT BMI CASES EGCUT CONTROLS EGCUT T2D CASES EGCUT CoreExome EMBRACE FENLAND FIA3 GEN SCOT GLACIER GO DARTS KORA KORC LBC21 LBC36 LOLIPOP HE LOLIPOP OE LRGP OXBB SEARCH Breast SEARCH - Control SEARCH - Ovarian SHIP SIBS UKHLS SI SC: n=98,977 (UK Biobank + UK BiLEVE n=51,043) 1905 2461 3243 5537 851 397 1389 926 767 836 4642 604 1333 2387 9810 928 4447 2843 836 503 983 1664 977 2070 4301 3465 1810 723 7396 878 9176 PY: n=108,397 (UK Biobank + UK BiLEVE n=40,624) CPD: n=109,323 (UK Biobank + UK BiLEVE n=40,882) GSCAN Cohort ARIC FINNTWIN FUSION GECCO HRS ID1000 MEC METSIM MHI NAGOZALC NESCOG SARDINA TWINSUK UK BIOBANK UK BILEVE GFG SI 8970 1467 1153 6459 6393 803 1903 8146 6820 1038 486 5069 878 73331 39480 2994 CHDExome+ Cohort BRAVE CCHS CGPS CIHDS PROSPER EPIC-CVD INTERVAL PROMIS SI 5543 6287 11781 3434 1279 21475 ? 9005 UK BiLEVE: UK Biobank Lung Exome Variant Evaluation 14 Red: Relatively large sample sizes (n>5k)
Quality Control (QC) steps within studies Step 1: Histograms of (i) ALT_EFFSIZE (ii) SQRT_V_STAT and (iii) U_STAT (parameter: INFORMATIVE_ALT_AC >2) I ve created a histograms of ALT_EFFSIZE, U_STAT and SQRT_V_STAT to check whether the former two are normally distributed, and that the latter looks similar to other cohorts (like a valley seems to be the shape expected for Human Exome chip arrays). U-statistics summarize the genomic similarity between pair of individuals and link this similarity to phenotype similarity 15
QC steps within studies (a simple way to observe confounding effects) Step 2: QQ plots I ve plotted a q-q plot for each dataset to check for p-value inflation and that the results are plausible/not biased Quantile-Quantile plots show the expected distribution of association test statistics across the hundreds of thousands of SNPs compared to the observed values. Any deviation from the X=Y line implies a consistent difference between cases and controls across the genome. 16
QC steps across studies Step 3: Plots of (i) var(U_STAT) v N_INFORMATIVE' and (ii) 'mean(SQRT_V_STAT) v Sqrt(N_INFORMATIVE) (parameter: ALT_AF>0.05) Cohort ARIC COGA FINNTWIN FUSION GECCO HRS ID1000 MEC METSIM MHI MN NAGOZALC NESCOG SARDINA TWINSUK UKBIOBANK UKBILEVE WHI Var(U_STAT) N 1900.64 406.85 270.49 205.05 1007.54 1179.11 125.15 389.59 507.95 1588.16 631.26 249.99 73.94 656.63 126.42 7521.31 6606.46 1943.25 5381 1465 819 568 2916 3303 366 1087 1374 4391 2043 671 217 1969 358 21525 19357 6246 Var(U_STAT) v sample size of GSCAN (CPD) datasets. This is a good QC step to check for any outlier datasets as we are comparing them against each other. It is good sign if there is a linear relationship (as in this sample) MAF parameter: 0.05 17
QC steps positive controls Step 4: Replication of previously reported SNPs A nice peak on a (clean, non-noisy) Manhattan plot at the 15q25 loci is a good sign for smoking-behaviour related traits The y-axis shows the log10P values of ~1,000,000 SNPs, and the x-axis shows their chromosomal positions. SNPs with P<5e-8 are highlighted in green. 18
Excluded datasets & reasons SI SC CPD PY South Asian sample & Non-normally distributed South Asian sample & Non-normally distributed South Asian sample South Asian sample BRAVE South Asian sample South Asian sample & Non-normally distributed South Asian sample South Asian sample PROMIS Missing many RAREMETAL columns & Very low lambda (0.068) Missing many RAREMETAL columns & Very low lambda (0.21) Missing many RAREMETAL columns & Very low lambda (0.042) Missing many RAREMETAL columns & Very low lambda (0.047) INTERVAL Non-normally distributed Non-normally distributed Non-normally distributed LRGP Non-normally distributed PROSPER Non-normally distributed CCHS Very low lambda (0.17) EPIC 50 cohorts (n=286425) 36 cohorts (n=98977) 50 cohorts (n=109323) 45 cohorts (n=108397) TOTAL 19
Problematic datasets CCHS SC dataset (n=4021) Parameter: MAC 3 20
Results: Previous signals Loci Trait Reported SNP (UK BiLEVE) Proxy Chr:Pos Proxy Ref:Alt Proxy Beta P value R2 rs1051730 (rs71448806) 15:78894339 15q25 (CHRNA3) CPD G>A 0.08 1.99e-30 0.99 (rs1051730) 7:32338337 (rs215607) 7p14 (PDE1C) CPD (PY) rs215605 (rs215600) G>A -0.01 0.027 (1.69e-07) 0.30 8p11 (CHRNB3) rs13280604 8:42559586 (rs13280604) 10:93348120 (rs1329650) NA CPD G>T -0.027 5.68e-10 1 LOC100188947 rs1329650 CPD G>T -0.005 0.04 1 EGLN2 rs3733829 CPD NA NA NA NA 19q13 (RAB4B) rs7937 19:41310571 (rs3733829) CPD A>G 0.005 0.005 0.34 DBH rs3025343 (rs111280114) 9:136478355 SC G>A -0.021 2.64e-05 1 (rs3025343) 11:27679916 (rs6265) BDNF rs6265 (rs2049045) SI C>T -0.01 1.63e-06 1 NCAM1 (rs4466874) 11:112866456 (rs4144892) (non H-Ex) 2:146125523 (rs10427255) 1:99445471 (non H-Ex) SI C>T 0.055 4.73e-10 1 TEX41/PABPC1P2 (rs10193706) SI C>T -0.014 1.74e-13 0.49 LPPR5 (rs61784651) SI C>T 0.044 0.0001 1 DNAH8 (rs10807199) NA SI NA NA NA NA NOL4L (rs143125561;rs57342388) NA SI NA NA NA NA *r2 value between proxy SNP in Human-exome chip and previously reported SNP is presented in final column 21
Results: Novel signals for follow-up? Consequence Loci Trait SNP ID Chr:Pos Ref:Alt Beta Pooled MAF P value (not corrected) X:136113464 GPR101 CPD & PY exm1659559 (rs1190736) C>A -0.027 & -0.022 0.36 & 0.39 1.40e-11 & 4.98e-09 missense 1:161771868 ATF6 CPD exm118559 (rs141611945) exm-rs7914558 (rs7914558) rs12616219 (non H-Ex) rs11895381 (non H-Ex) rs1150691 (non H-Ex) rs462779 A>G 1.707 MAC=9 (~113k) 2.95e-07 missense CNNM2 10:104775908 SI G>A 0.0122 0.397 1.94e-10 intronic TMEM182- POU3F3 BCL11A 2:104352495 (rs9308868) SI C>A -0.046 0.194 5.49e-08 (4.9e-04) intergenic 2:60053727 SI A>G 0.05 0.29 5.62e-09 intergenic ZSCAN9 6:28168033 SI A>G -0.049 0.13 4.95e-08 intergenic REV3L 6:111695887 SI G>A -0.014 0.19 1.38e-08 missense GAPVD1 rs2841334 (non H-Ex) exm1227414 (rs11639856) exm1276230 (rs216195) exm1643833 (rs11539157) rs202664 (non H-Ex) 9:128122320 (rs534214) SI G>A -0.058 0.086 2.28e-08 (7.56e-04) intronic TNRC6A 16:24788645 SI T>A -0.014 0.191 1.26e-08 missense SMG6 17:2203167 SI T>G -0.013 0.272 8.25e-09 missense PJA1 X:68381264 SI C>A 0.017 0.165 1.39e-11 missense TEF-TOB2 22:41813886 SC T>C -0.115 0.103 1.02e-08 intergenic Bold: P value <5e-8 even after excluding UK Biobank and BiLEVE samples. Red: Do not reach threshold when cohort-level GC correction applied 22 Call rate and HWE P-value thresholds were 99% and >5e-5 respectively
Manhattan plots P-value threshold: 5e-7 for rare Human-Exome chip SNPs (dark blue line), 5e-8 for others (red line) Only autosomes shown. PY omitted as there were no novel signals. Dark Blue: previous signals; Red; novel signals. Results capped at 14. 23
QQ plots CPD 24 No SNP QC filters
PY 25 No SNP QC filters
SI 26 No SNP QC filters
SC 27 No SNP QC filters
Consortium specific meta-analysis for top SNPs CNNM2 (SI, P-value: 1.94e-10) CGSB P-value: 2.38e-05 (n=78,052) + GSCAN P-value: 2.02e-06 (n=165,387) + CHDExome+ P-value: 0.0087 (n=42,976) + ATF6 (CPD, P-value: 2.95e-07) CGSB P-value: 0.00017 (n=26,506) + GSCAN P-value: 0.005 (n=69,695) + CHDExome+ P-value: 0.025 (n=7,364) + REV3L (SI, P-value: 1.38e-08) CGSB P-value: 1.19e-05 (n=78,048) - GSCAN P-value: 0.0012 (n=165,368) - CHDExome+ P-value: 0.029 (n=42,976) - GPR101 (CPD, P-value: 1.40e-11) CGSB P-value: 0.0010 (n=26,499) - GSCAN P-value: 3.41e-09 (n=51,050) - CHDExome+ P-value: NA PJA1 (SI, P-value: 1.39e-11) CGSB P-value: 8.72e-07 (n=78,040) + GSCAN P-value: 3.09e-07 (n=108,512) + CHDExome+ P-value: NA SMG6 (SI, P-value: 8.25e-09) CGSB P-value: 0.0013 (n=78,056) - GSCAN P-value: 2.04e-05 (n=154,822) - CHDExome+ P-value: 0.002 (n=42,359) - TNRC6A (SI, P-value: 1.26e-08) CGSB P-value: 0.0009 (n=78,032) - GSCAN P-value: 1.61e-06 (n=165,386) - CHDExome+ P-value: 0.011 (n=42,976) - 28
Next steps Replication All sentinel SNPs except ATF6 SNP are on the UK Biobank custom (Axiom) array ATF6 SNP MAF in Africans (1.2%), Latinos (0.1%), Europeans (0.019%) and South Asians (0.003%) MAFs from gnomAD Other follow up studies: eQTL databases, biological pathway enrichment, literature review, druggability, pleiotropy 29
Acknowledgements CGSB cohorts Airwave, ASCOT (Scotland and UK), 1958BC, BRIGHT, Croatia- KORCULA, DIABNORD, EFSOCH, EGCUT, EMBRACE, Fenland, FIA3, GS:SFHS, GLACIER, GoDARTS, KORA F4, LBC1921, LBC1936, Lifelines, LOLIPOP, LRGP, OxBB, SEARCH, SHIP, SIBS, UKHLS Collaborators Colorado/Michigan Dajiang Liu & Mengzhen Liu Cambridge Jo Howson Vicki/Martin/Louise/Nick Carl worked on the project before me 30
Appendices 31
Gene-based analyses Parameters: Only Human-Exome chip SNPs SNPs with MAF<5% Annotations used: Nonsynonymous, Stop gain, Splice Site, Start Gain, Start Loss, Stop Loss and Synonymous variants. Variant collapsing methods SKAT, Burden test, Variable threshold (VT), Madsen-Browning (MB) method 32
Gene-based analyses - Results Not many novel genes to follow up Most are explained by one signal or a single strong signal amongst many variants CHRNA5 implicated by all three tests for CPD CRCP (calcitonin gene-related peptide (CGRP)- receptor component protein) implicated in MB and VT tests for CPD trait by three rare variants (P-values: 0.041, 0.004, 0.046) MMP17 implicated by VT (and Burden) test for PY (>10 variants) 33
Sensitivity analyses SNP/Analysis Primary analysis 1.94e-10 -UKBiobank samples 7.33e-08 I2 test for heterogeneity CGSB: 13.13%, Q-test P-value: 0.26; GSCAN: 7.05%, Q-test P-value: 0.37; CHDExome+: 0%, Q-test P-value: 0.83 CNNM2 CGSB: 16.91%, Q-test P-value: 0.207; GSCAN: 31.33%, Q-test P-value: 0.12; CHDExome+: 4.03%, Q-test P-value: 0.37 NA NA REV3L 1.38e-08 8.13e-07 TNRC6A SMG6 PJA1 1.26e-08 8.25e-09 1.39e-11 1.97e-06 1.35e-07 4.53e-09 CGSB: 17.98%, Q-test P-value: 0.21; GSCAN: 30.07%, Q-test P-value: 0.18 CGSB: 10.98%, Q-test P-value:; 0.31 GSCAN: 0.58%, Q-test P-value: 0.43 GPR101 (CPD) 1.40e-11 3.28e-07 P-values obtained from each SI analysis is shown in the corresponding box (unless stated otherwise). -UKBiobank: Both UK Biobank and UK BiLEVE samples are excluded from primary analysis. 34
