Fundamentals of Descriptive Statistics and Probability Distributions
Descriptive statistics play a vital role in data analysis by summarizing data through measures like mean and variance. Probability distributions help generalize from samples to populations, enabling the calculation of outcome probabilities. This session covers categorizing variables, calculating means, and exploring variations in data sets.

Download Presentation

Please find below an Image/Link to download the presentation.
The content on the website is provided AS IS for your information and personal use only. It may not be sold, licensed, or shared on other websites without obtaining consent from the author.If you encounter any issues during the download, it is possible that the publisher has removed the file from their server.
You are allowed to download the files provided on this website for personal or commercial use, subject to the condition that they are used lawfully. All files are the property of their respective owners.
The content on the website is provided AS IS for your information and personal use only. It may not be sold, licensed, or shared on other websites without obtaining consent from the author.
E N D
Presentation Transcript
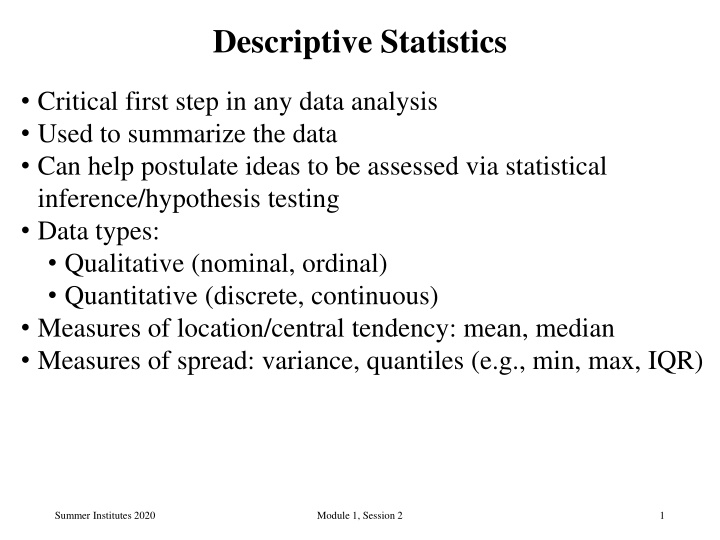
Descriptive Statistics Critical first step in any data analysis Used to summarize the data Can help postulate ideas to be assessed via statistical inference/hypothesis testing Data types: Qualitative (nominal, ordinal) Quantitative (discrete, continuous) Measures of location/central tendency: mean, median Measures of spread: variance, quantiles (e.g., min, max, IQR) Summer Institutes 2020 Module 1, Session 2 1
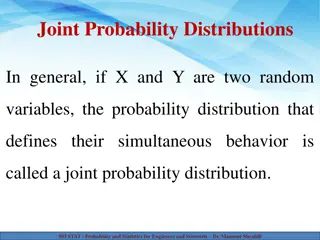
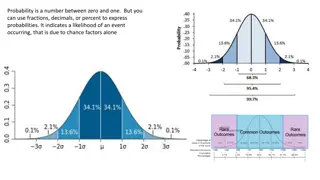
Probability Distributions Allows a generalization from the sample to the population The theoretical distributions of outcomes let us to calculate the probability of a given outcome e.g., binomial distribution of binary outcomes, normal distribution of continuous outcomes Mean and variance of a random variable X Properties of these can be used to calculate the mean and variance of any linear transformation of X Summer Institutes 2020 Module 1, Session 2 2
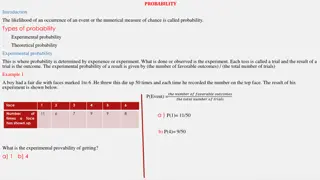
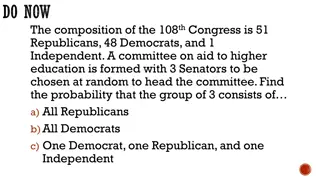
Question 1 Categorize the following variables into nominal, ordinal, discrete, or continuous a) Viral load b) Age measured in years c) Price of your lunch d) Zip code of your residence Answers a) continuous b) discrete c) continuous d) nominal Summer Institutes 2020 Module 1, Session 2 3
Questions 2, 3, 4 12 2. What is ?? ?=10 3 3. What is ?2? ?=1 4. What is the mean of -5, 10, and 0? Answers 2. = 10 + 11 + 12 = 33 3. = 12 + 22 + 32 = 1 + 4 + 9 = 14 4. (-5 + 10 + 0)/3 = 5/3 = 1.667 Summer Institutes 2020 Module 1, Session 2 4
Question 5 a) If I buy a bag of 3 bagels, and they weigh 85g, 95g and 90g, what is the mean weight? b) If I buy a bag of 3 bagels and they weigh 0.085 kg, 0.095 kg and 0.09 kg, what is the mean weight? c) If I add 20 grams of cream cheese to each of my bagels, what is the mean (combined) weight of my breakfast? Answers a) = (85g + 95g + 90g)/3 = 90g b) = (0.085kg + 0.095kg + 0.09kg)/3 = 0.090kg c) = (105g + 115g + 110g)/3 = 110g Summer Institutes 2020 Module 1, Session 2 5
Question 6 a) If I buy a bag of 3 bagels, and they weigh 85g, 95g and 90g, what is the variance and standard deviation of the weight? (Recall that the mean was 90g) b) What is the variance and standard deviation of the weight of the 3 bagels if 20g of cream cheese is added to each bagel? Answers a) s2 = [(85-90)2 + (95-90)2 + (90-90)2]/(3-1) = [25 + 25 + 0]/2 = 50/2 = 25 s = 5 b) s2= 25, s = 5 (adding a constant doesn t change the variance or standard deviation estimate) Summer Institutes 2020 Module 1, Session 2 6
Questions 7, 8, 9 Suppose a new student has joined your lab and is learning how to culture cells. Their reference letter says that 25% of the new student s experiments fail. They only have time to create 3 cultures. 7. What's the probability that exactly 1 experiment fails? 8. What's the probability that at least 1 experiment fails? 9. What's the probability that all experiments succeed? Recall: where, e.g., 4! = 4 x 3 x 2 x 1 = 24 Summer Institutes 2020 Module 1, Session 2 7
Questions 7, 8, 9 Answers 7. 8. 9. Summer Institutes 2020 Module 1, Session 2 8
Question 10 10. A couple intends to have 5 children and both are carriers of myotonic dystrophy, a dominant trait. Therefore, the probability that a child has the trait is 0.75. What is the probability that at least 1 child will have the trait? The probability of any single child having the trait is 0.75, and the carrier status of each child is independent of every other. The number of children with the trait (X) is therefore a binomially-distributed random variable with n = 5 and p = 0.75. Summer Institutes 2020 Module 1, Session 2 9
Question 11 11. Calculate the mean and variance of a binomially distributed random variable with n trials and success probability p. If X ~ Bin(n,p) and Y1, Y2 Yn are independent Bernoulli random variables with success probability p, then X has the same distribution as Y1 + Y2 + + Yn. So, Summer Institutes 2020 Module 1, Session 2 10