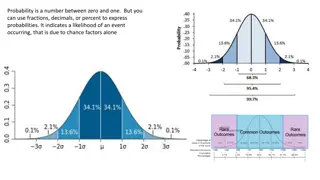
Probability and Statistics for Data Science Course Overview
This online course on Probability and Statistics for Data Science covers essential topics such as Probability theory, Statistical inference, Regression analysis, and more. The course emphasizes the application of statistical techniques in data analysis and provides a solid foundation in Probability and Statistics necessary for Data Science. Prerequisites include knowledge of Probability and Statistics, basic CS, and programming skills (Python). The course is theory and algorithms-focused, not a systems course.

Download Presentation

Please find below an Image/Link to download the presentation.
The content on the website is provided AS IS for your information and personal use only. It may not be sold, licensed, or shared on other websites without obtaining consent from the author.If you encounter any issues during the download, it is possible that the publisher has removed the file from their server.
You are allowed to download the files provided on this website for personal or commercial use, subject to the condition that they are used lawfully. All files are the property of their respective owners.
The content on the website is provided AS IS for your information and personal use only. It may not be sold, licensed, or shared on other websites without obtaining consent from the author.
E N D
Presentation Transcript
CSE 544 (online) Probability and Statistics for Data Science Lecture 1: Intro and Logistics Instructor: Anshul Gandhi Department of Computer Science 1
CSE 544 (online) Probability and Statistics for Data Science Online engagement: Participants can decide video on/off Keep participant audio on/off? Participants can chat with host (please do) Keep host audio on (obviously) Host video off Host will share slides throughout Do not disturb/disrupt the lecture, please! 2
CSE 544 Probability and Statistics for Data Science What is Data Science? Analysis of data (using several tools/techniques) Statistics/Data Analysis + CS 3
CSE 544 Probability and Statistics for Data Science Who is a Data Scientist Statistics/Data Analysis + CS Someone who is better at stats than the average CS person and someone who is better at CS than an average statistician. 4
Contact Info: Anshul Gandhi 347, New CS building anshul@cs.stonybrook.edu anshul.gandhi@stonybrook.edu PLEASE USE PIAZZA FOR ALL COMMUNICATION (more on this later) 5
Outline 1. Logistics Course info Remote instruction Lectures Office hours Course webpage + resources 2. Grading 3. Syllabus Tentative schedule 6
Course Info Probability theory Probability review (basics, conditional prob, Bayes theorem) Random variables (mean, variance, Geometric, Normal) Stochastic processes (Markov chains, ) Statistical inference Non-parametric inference (empirical distribution, sample mean, bias, confidence intervals) Parametric inference (method of moments, max. likelihood) Hypothesis testing (truth table, various tests, p-values) DS techniques Bayesian inference (Bayesian reasoning, conjugate priors) Regression analysis (linear regression, time series analysis) 7
Course Info Prerequisites: Probability and Statistics Will greatly help! Basic CS + programming background We will use Python This is NOT a systems course More of a theory + algorithms course 8
Course Info Required and recommended texts: Software: Available from DoIT 9
Example 1: Simple stats X is a collection of 99 integers (positive and negative) Mean(X) > 0 How many elements of X are > 0? Same question but now Median(X) > 0? 10
Remote Instruction All lectures via Zoom Same link as today (recurring meeting) All lectures synchronous (live) All components will be online via Zoom or BB, including assignment release and submission, exams, office hours, TA office hours, etc. 11
Lectures Mon Wed: 8:15pm 9:35pm Via Zoom (link on BB) 5-min break at the halfway point Live slides + annotations Recordings will be on BB, slides on website Occasionally some programming (Python) Posted on website after class May have cancellations due to weather or unavailability Will be emailed and updated on website Weather-related class cancelations decided by SBU 12
Lectures Interactive (please): chat/audio Some ungraded quizzes on BB for self-evaluation and practice Plan to take notes somewhere (book, tablet) Attendance is not mandatory but strongly encouraged All off-class communication (changes in deadlines, class cancelations, etc.) will be via piazza Please sign-up and change communication mode to real-time 13
Office hours Mon, Wed 10-11am (from next week) Will re-visit after add/drop date Via Zoom, will create a link and share Do not email me your Qs, wait for OH Large class, easier to address Qs during OH TA and TA Office hours: TBD Will have a 1-hour TA OH every week, for assignment help Piazza for assignment queries (do not give away answers) 14
Example 2: Correlation v/s Causation Q1: Are A and B correlated? A B 15
Example 2: Correlation v/s Causation Q2: Which of the following is true (i) A causes B (ii) B causes A (iii) Either (i) or (ii) (iv) None of the above A B 16
Example 2: Correlation v/s Causation Q2: Which of the following is true (i) A causes B (ii) B causes A (iii) Either (i) or (ii) (iv) None of the above A B 17
Example 3: Correlation v/s Causation BLUE: # daily covid cases in US RED: amazon reviews claiming no scent for Yankee candles 2021 19
Course webpage www.cs.stonybrook.edu/~cse544 (will redirect) Please bookmark this page This is your best resource! Will be regularly updated Lecture slides Assignment and exam dates Assignment data files Readings Python scripts discussed in class 20
Other resources Piazza (link on website) Primary mode of communication, please sign up! Helpful for posting lecture or assignment doubts TAs will respond in a timely manner Do NOT wait till the last moment Announcements, abundance of caution, etc. Blackboard for assignments, exams, solutions, grades Assignment submission also via BB Zip all files (pdf of solution, py files, graphs, etc.) BB for in-class quizzes 22
Example 3: Inspection Paradox On average, an SBU shuttle arrives at the SAC loop every 20mins. If you show up at the SAC loop at some random time, let W be the #mins you end up waiting for a shuttle. What is E[W]? W t=0 t=20 23
Example 3: Inspection Paradox On average, an SBU shuttle arrives at the SAC loop every 20mins. If you show up at the SAC loop at some random time, let W be the #mins you end up waiting for a shuttle. Can E[W] > 10mins? W t=0 t=40 24
Example 3: Inspection Paradox On average, an SBU shuttle arrives at the SAC loop every 20mins. If you show up at the SAC loop at some random time, let W be the #mins you end up waiting for a shuttle. Can E[W] > 20mins? W t=0 t=60 25
Example 3: Inspection Paradox Students at BSU complain about large class sizes. In an unbiased sample poll of students, the average reported class size was far beyond 100. However, BSU admin swears that the average class size is less than 50. Who is lying? 10 students 10 students CSE 544, 180 students 10 students 10 students Avg class size = (180 + 10 + 10 + 10 + 10)/5 = 220/5 = 44 < 50 Reported average = (180*180 + 4*10*10)/220 = 149 > 100 26
Grading 45% assignments 45% exams (online mid-terms) 10% group mini-project Grading is on a curve Some parts are tentative! 27
Grading - assignments 45% assignments 6 assignments (roughly once every 1.5 weeks) 6-8 problems per assignment Later assignments will have more programming Qs based on lectures, but tougher on purpose Collaboration is allowed (groups of at most 4) One write-up/upload per group Discuss among group DO NOT COPY OR DISCUSS ACROSS GROUPS! If a group member is inactive, let me know asap You can change groups (check with me first) 28
Grading - assignments Submit all files (scanned pdf, py files) as one archive on BB Solutions can be typed or hand-written (legible) Only one group member needs to submit, mention all names Assignments due at the beginning of class Due date posted on class website and in assignment pdf Example: A1 due on Feb 9th BB submission site will mark submission after 8:15pm on Feb 9th as LATE, will not be graded if late NO LATE SUBMISSIONS, NO UPDATES, NO EXCEPTIONS Not all questions will be addressable on release date 29
Grading - exams 45% exams Mid-terms 1 and 2 20% mid-term 1 (probs & stats), mid-March 25% mid-term 2 (inference), early May Non-overlapping Exams administered via BlackBoard Open-book, open-notes exams MCQ + fill in the blanks Randomized Qs and As, tightly timed, to discourage cheating No programming questions Somewhat easier than assignments, but will test concepts No collaborations, obviously Will release practice mid-term exam a week prior 30
Grading quizzes 0% Roughly once a week or so Very simple, 1 Q, via BB (for practicing BB exams) Purpose: self-evaluation Best to do this yourself This is in response to student requests from prior sems 31
Grading group mini-project 10% group mini-project Basically, assignment 7, due at end of semester Data analysis project Programming involved Same as assignment group (can change if needed) 2nd half of the semester Will discuss details as we go along 32
Grading - recap 45% assignments (6 assignments, in groups of max 4) 45% exams (timed, BB exams) 10% group mini-project 0% quizzes Some parts are tentative! Will provide mid-sem grades (after M1) For self-evaluation purposes only 33
Syllabus Probability Theory (8 lectures, 2 assignments) Probability review (events, computing probability, conditional prob., Bayes thm.) Random variables (Geometric, Exponential, Normal, expectation, moments, etc.) Probability inequalities (Weak Law of Large Numbers, Central Limit thm., etc.) Markov chains (stochastic processes, balance equations, etc.) MID-TERM 1 (Early March) Statistical Inference (~12 lectures, 3 assignments) Non-parametric inference (empirical PDF, bias, kernel density, plug-in estimator) Confidence intervals (percentiles, Normal-based CIs) Parametric inference (method of moments, max likelihood estimator) Hypothesis testing (Wald s test, t-test, KS test, p-values, permutation test) Bayesian inference (Bayesian reasoning, inference, etc.) Data Science Models (2-3 lectures, 1 assignment) Regression (simple LR, multiple LR, non-linear regression) Time series analysis (moving average, EWMA, AR, ARMA, ARIMA) MID-TERM 2 (Early May) 34 MINI-PROJECT (Early May)
Syllabus www.cs.stonybrook.edu/~cse544 35
Next class Probability review - 1 Basics: sample space, outcomes, probability Events: mutually exclusive, independent Calculating probability: sets, counting, tree diagram 36
Questions?? 37
")
")