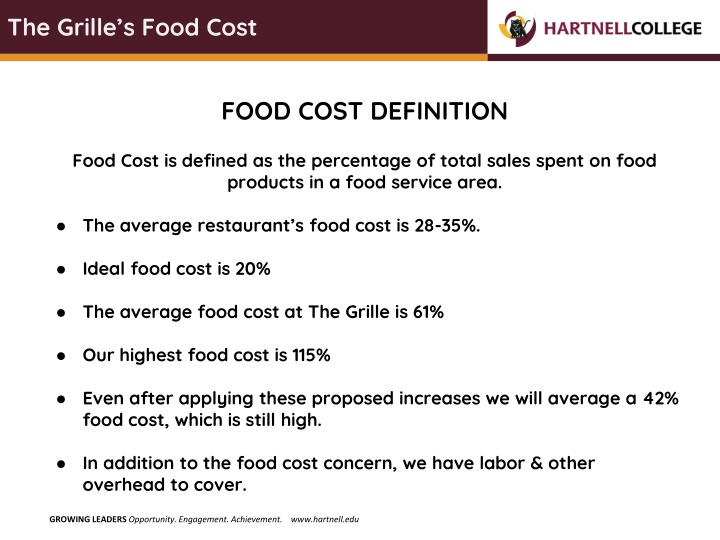
FOOD COST DEFINITION
Food cost management is crucial for any food service area to maintain profitability. The Grille is facing high food costs and needs to strategize to reduce them while covering labor and overhead expenses. The provided data includes comparisons, potential cost scenarios, and actual food cost analysis at local campuses.

Download Presentation

Please find below an Image/Link to download the presentation.
The content on the website is provided AS IS for your information and personal use only. It may not be sold, licensed, or shared on other websites without obtaining consent from the author.If you encounter any issues during the download, it is possible that the publisher has removed the file from their server.
You are allowed to download the files provided on this website for personal or commercial use, subject to the condition that they are used lawfully. All files are the property of their respective owners.
The content on the website is provided AS IS for your information and personal use only. It may not be sold, licensed, or shared on other websites without obtaining consent from the author.
E N D
Presentation Transcript
The Grilles Food Cost FOOD COST DEFINITION Food Cost is defined as the percentage of total sales spent on food products in a food service area. The average restaurant s food cost is 28-35%. Ideal food cost is 20% The average food cost at The Grille is 61% Our highest food cost is 115% Even after applying these proposed increases we will average a 42% food cost, which is still high. In addition to the food cost concern, we have labor & other overhead to cover. GROWING LEADERS Opportunity. Engagement. Achievement. www.hartnell.edu
Average Food Cost vs. The Grille Food Cost Average Food Cost (28-35%) Food Cost Remaining Percentage after covering food cost, to cover additional overhead The Grille s Food Cost (61%) Remaining Percentage after covering food cost, to cover additional overhead Food Cost GROWING LEADERS Opportunity. Engagement. Achievement. www.hartnell.edu
The Grilles Labor & Other Overhead Employees: Food Service Manager Part-time Assistant (CSEA)- vacant due to budget restrictions Lead Food Service Worker, 11-month (L-39) Food Service Worker, 10-month (L-39) Food Service Worker, 10-month (L-39) Part-time Food Service Worker, 9-month (L-39) Student Workers (1-5 depending on demand) Equipment, Equipment Maintenance, & Cloud Storage contracts Credit card processing fees (processing fee, interchange fee, assessment fee) Linen & Cleaning Supplies Water & Coffee Systems Food & Beverage Components Delivery Fees GROWING LEADERS Opportunity. Engagement. Achievement. www.hartnell.edu
Potential Food Cost Potential Food Cost is a theoretical or ideal percentage that indicates what the food cost should be in a perfectly run food service area. In order to achieve our potential food cost, we must raise the prices of our handmade food by at least 70% while also increasing business. Our goal is to only have to increase prices by 60% and make up the additional 10% with catering. GROWING LEADERS Opportunity. Engagement. Achievement. www.hartnell.edu
Actual Cost of Food at Local Campuses Hartnell to MPC % change Hartnell to Gavilan % change ITEM HARTNELL MPC GAVILAN Hamburger 3.5 8 6.29 128.57% 79.71% Cheeseburger 4 9 7.69 125.00% 92.25% Chicken Sandwich 3.75 10.5 7.49 180.00% 99.73% Turkey Club 5.5 11 9.89 100.00% 79.82% Tuna Sandwich 4.75 10.5 8.89 121.05% 87.16% Grilled Cheese 3.25 7 5.99 115.38% 84.31% Quesadilla 3.5 5 5.95 42.86% 70.00% Chicken Tenders 3.5 7.5 6.29 114.29% 79.71% Burrito 6 10.5 10.29 75.00% 71.50% Breakfast Burrito 5.5 8 8.49 45.45% 54.36% Parfait 2.75 6 5.79 118.18% 110.55% Breakfast Sandwich 3.75 7 6.89 86.67% 83.73% Turkey Sandwich 4.75 9 8.89 89.47% 87.16% Chicken Caesar Salad 5.5 10 10.29 81.82% 87.09% Green Salad 3.75 9 6.99 140.00% 86.40% Average Item = 4.109375 8.25 7.475 103.98% 83.00% GROWING LEADERS Opportunity. Engagement. Achievement. www.hartnell.edu
Cost of Food Comparison GROWING LEADERS Opportunity. Engagement. Achievement. www.hartnell.edu
Three Phase Application of Increases ITEM Current Pricing Spring FY24 Fall FY25 Spring FY25 Hamburger 3.5 4.20 4.90 5.6 Cheeseburger 4 4.80 5.60 6.4 Chicken Sandwich 3.75 4.50 5.25 6 Turkey Club 5.5 6.60 7.70 8.8 Tuna Sandwich 4.75 6.10 7.45 8.8 Grilled Cheese Quesadilla 3.25 3.5 3.90 4.00 4.55 4.50 5.2 5 Chicken Tenders 3.5 4.20 4.90 5.6 . Burrito 6 7.20 8.40 9.6 Fries 2 2.43 2.87 3.3 Breakfast Burrito 5.5 6.33 7.17 8 Parfait 2.75 3.30 3.85 4.4 Breakfast Sandwich 3.75 4.50 5.25 6 Turkey Sandwich 4.75 5.70 6.65 7.6 Chicken Caesar Salad 5.5 6.60 7.70 8.8 Green Salad 3.75 4.50 5.25 6 Average Item = 4.109375 4.929166667 5.748958333 6.56875 GROWING LEADERS Opportunity. Engagement. Achievement. www.hartnell.edu
Proposed Pricing Compared to Local Institutions Hartnell to MPC %Change Hartnell to Gavilan %Change ITEM Hartnell Proposed Prices MPC GAVILAN Hamburger 5.6 8 6.29 42.86% 12.32% Cheeseburger 6.4 9 7.69 40.63% 20.16% Chicken Sandwich 6 10.5 7.49 75.00% 24.83% Turkey Club 8.8 11 9.89 25.00% 12.39% Tuna Sandwich 8.8 10.5 8.89 19.32% 1.02% Grilled Cheese 5.2 7 5.99 34.62% 15.19% Quesadilla 5 5 5.95 0.00% 19.00% Chicken Tenders 5.6 7.5 6.29 33.93% 12.32% Burrito 9.6 10.5 10.29 9.38% 7.19% Fries 3.3 4 3.49 21.21% 5.76% Breakfast Burrito 8 8 8.49 0.00% 6.13% Parfait 4.4 6 5.79 36.36% 31.59% Breakfast Sandwich 6 7 6.89 16.67% 14.83% Turkey Sandwich 7.6 9 8.89 18.42% 16.97% Chicken Caesar Salad 8.8 10 10.29 13.64% 16.93% Green Salad 6 9 6.99 50.00% 16.50% Average Item = 6.56875 8.25 7.475 27.31% 14.57% GROWING LEADERS Opportunity. Engagement. Achievement. www.hartnell.edu
Proposed Cost of Food Increase Compared to Local Institutions GROWING LEADERS Opportunity. Engagement. Achievement. www.hartnell.edu
Actual Revenue in Comparison to What Revenue Should be. Actual Revenue in Comparison to Missed Revenue 9/1/23-10/1/23 Fresh Lunch Sales 52,573.10 If 60% price increase had been applied* Lost revenue for last month* 84,116.96 31,543.86 *Broad estimation without applying to each item individually Actual Revenue in Comparison to Missed Revenue 10/2/23-10/16/23 Fresh Lunch Sales 30,016.10 If 60% price increase had been applied* Lost revenue for last 2 weeks* 48,025.76 18,009.66 *Broad estimation without applying to each item individually GROWING LEADERS Opportunity. Engagement. Achievement. www.hartnell.edu
Hours of Operation Were Able to Provide vs. Contracted out Institutions CSUMB (approx. 4k students live on campus) HARTNELL MPC GAVILAN CABRILLO Summer Hours Closed on both of my visits, 11am & 2pm. No hours posted. Mon. 7:30am-2pm 9am-1pm 8:30am-1:30pm 7:30am-3pm Tues. 7:30am-2pm 9am-1pm 8:30am-1:30pm 7:30am-3pm Weds. 7:30am-2pm 9am-1pm 8:30am-1:30pm 7:30am-3pm Thurs. 7:30am-2pm 9am-1pm 8:30am-1:30pm 7:30am-3pm Fri. Sat. Sun. Closed Closed Closed Closed Closed Closed Closed Closed Closed Closed Closed Closed CSUMB (approx. 4k students live on campus) HARTNELL MPC GAVILAN CABRILLO Fall Hours Mon. 7:30am-7pm 8am-3pm (7am)11:00am-8pm 7:30am-2pm 7:30am-5pm Tues. 7:30am-7pm 8am-3pm (7am)11:00am-8pm 7:30am-2pm 7:30am-5pm Weds. 7:30am-7pm 8am-3pm (7am)11:00am-8pm 7:30am-2pm 7:30am-5pm Thurs. 7:30am-7pm 8am-3pm (7am)11:00am-8pm 7:30am-2pm 7:30am-5pm Fri. Sat. Sun. 7:30am-2pm Closed Closed 8am-1pm Closed Closed (7am)11:00am-8pm 10am-4pm 11am-4pm Closed Closed Closed Closed Closed Closed GROWING LEADERS Opportunity. Engagement. Achievement. www.hartnell.edu
Recommendations/Requests Implement 1st phase of pricing increases at the beginning of the upcoming Spring term Complete all pricing increases by the end of FY25 (while basic needs funds are still available) No changes to most packaged food pricing as its pricing is dictated by the purveyor and has a more sustainable margin. Increase prices of handmade/fresh food by 50-75% which will still keep us below the pricing at other local institutions. We will roll this out in 3 phases, not all at once. Increase foot traffic through increased enrollment, advertising, customer satisfaction, and online ordering. (A majority of our handmade food is being sold at a loss. If we simply increase volume without increasing pricing, we will only increase the deficit.) Increase catering sales. Operate during hours consistent with class and work scheduling to provide food service when reasonable. Continue to provide students with a wide variety of options at the best price possible. Eventually be able to offer food at a discounted rate to the students. GROWING LEADERS Opportunity. Engagement. Achievement. www.hartnell.edu
Questions? GROWING LEADERS Opportunity. Engagement. Achievement. www.hartnell.edu