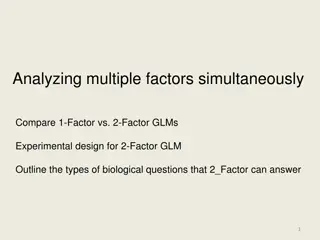
Fixed effects analysis in a Two – way ANOVA
Two-way ANOVA analysis focusing on fixed effects with crossed main effects and nested experimental units. Understand the parameters, hypotheses, expected mean squares, and ANOVA effect tests to evaluate Phosphor Type, Glass Type, and their interaction. Perform interaction plots and examine main effects to draw meaningful conclusions.

Download Presentation

Please find below an Image/Link to download the presentation.
The content on the website is provided AS IS for your information and personal use only. It may not be sold, licensed, or shared on other websites without obtaining consent from the author.If you encounter any issues during the download, it is possible that the publisher has removed the file from their server.
You are allowed to download the files provided on this website for personal or commercial use, subject to the condition that they are used lawfully. All files are the property of their respective owners.
The content on the website is provided AS IS for your information and personal use only. It may not be sold, licensed, or shared on other websites without obtaining consent from the author.
E N D
Presentation Transcript
Crossing and Nesting, Balanced Phosphor Type and Glass Type (the main effects) are crossed For example, Phosphor Type 1 means the same thing regardless of Glass Type Since main effects are crossed we can check for interaction Experimental units are nested within combinations of Phosphor Type and Glass Type Experimental unit 1 for one combination of Phosphor Type and Glass Type does not mean the same thing as Experimental unit 1 for a different combination of Phosphor Type and Glass Type Since there are three observations for each cell the design is balanced 3
Fixed and Random effects Suppose we ran the experiment again. Phosphor type and Glass type would mean the same thing in another run of the experiment so we call them Fixed Effects in the Model. The experimental units are not the same, so we call them Random Effects in the Model. 4
Linear Model = + + + + Y P G PG ( ) ij k ijk i j ij 5
Problem 5.6 ANOVA Effect Tests Source DF Sum of Squares F Ratio Prob > F Phos. Type Glass Type 2 933.33 8.8421 0.0044* 1 14450.0 273.78 <.0001* 1.2632 0.3178 Phos. Type*Glass Type 2 133.333 8
Test and do interaction plot, then look at main effects. F-test and plot of interaction. (F-test and plot of cell means) If not significant, go on to test Main Effects. 9
Tukey HSD Level 2 A 1 3 Least Sq Mean 273.33333 260.00000 256.66667 B B Levels not connected by same letter are significantly different. 12
Crossed and Nested Temperature and Glass are crossed Can check for Interaction Experimental units are Nested within Treatment combinations There are three observations per cell so the design is balanced 17
Linear Model = + + + + Y G T GT ( ) ij k ijk i j ij 18
Problem 5.10 Source DF Sum of Squares F Ratio Prob > F Glass Type 2 150864.5 Temp. 2 1970334.5 Glass *Temp. 4 290551.7 Error 18 2418330.1 206.3706 2695.259 198.7257 <.0001* <.0001* <.0001* 19
LS Means Table (usually put in appendix) Level Least Sq Mean Std Error 1, 100 572.6667 1, 125 1087.3333 1, 150 1386.0000 2, 100 553.0000 2, 125 1035.0000 2, 150 1313.0000 3, 100 573.3333 3, 125 1054.6667 11.038093 11.038093 11.038093 11.038093 11.038093 11.038093 11.038093 11.038093 11.038093 3, 150 886.6667 21
Now this is slick Level 1, 150 2, 150 B 1, 125 3, 125 2, 125 3, 150 3, 100 1, 100 2, 100 Least Sq Mean 1386.0000 1313.0000 1087.3333 1054.6667 1035.0000 886.6667 573.3333 572.6667 553.0000 A C C C D E E E Levels not connected by same letter are significantly different. 22
Normality test Shapiro-Wilk W Test W 0.966954 Prob<W 0.5237 Note: Ho = The data is from the Normal distribution. Small p-values reject Ho. 25


")