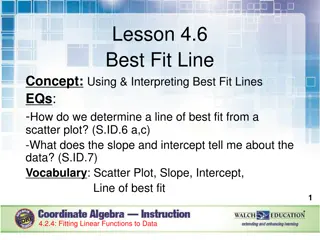
Finding Correlation Coefficient & Line of Best Fit


Finding Correlation
Finding Correlation
Coefficient
Coefficient
&
&
Line of Best Fit
Line of Best Fit
We want to
M CLR
the calculator to
Clear its Memory
Find the Correlation Coefficient for the following data
Finding Correlation Coefficient
Finding Correlation Coefficient
Finding Correlation Coefficient
Finding Correlation Coefficient
We want to
M CLR
the calculator to
Clear its Memory
Finding Correlation Coefficient
Finding Correlation Coefficient
We want the
calculator
in
STATS
mode
Finding Correlation Coefficient
Finding Correlation Coefficient
Finding Correlation Coefficient
Finding Correlation Coefficient
We want to find a
LINE
linking
the points
Finding Correlation Coefficient
Finding Correlation Coefficient
Enter each pair of
points separated
by a comma
Pressing
DATA
afterwards
Repeat the
process entering
all the Data in the
table
Finding Correlation Coefficient
Finding Correlation Coefficient
We want the
Correlation
Coefficient
r
Its in Green so
press ALPHA first
The
Correlation
Coefficient
= -0.775947983
Finding Correlation Coefficient
Finding Correlation Coefficient
Questions
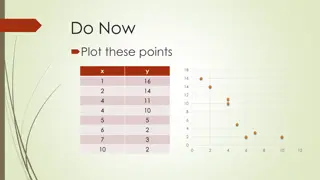
1.
The marks of 7 pupils in two Maths papers are as follows :
a)
Plot the marks on a scatter graph.
(Paper 1 marks on the horizontal axis and
Paper 2 marks on the vertical axis)
b)
Is there any correlation between the marks on Paper 1
and Paper 2 ?
c)
Use your calculator to find the Correlation coefficient
d) Find the equation of the Line of Best Fit for the data
Objective : To practise stating correlation.
e)
Eve achieves a score of 6 on Test A. Use the line of best fit
to give an estimate of her score on Test B.
Answers
1.
Yes there is positive correlation between Paper1 and
Paper 2.
2.
Top Gear are doing a review of cars. The table below shows
the engine size of a car in litres and the distance it travelled in
km on one litre of petrol.
Top Gear want to know if there is any correlation between
engine size and distance travelled.
a)
Plot the marks on a scatter graph.
b)
Is there any correlation between the Engine Size and Distance
c)
Use your calculator to find the Correlation coefficient
d) Find the equation of the Line of Best Fit for the data
e)
A car has a 2.3 litre engine. How far would you expect
it to go on one litre of petrol ?
Answers
2. Yes there is negative correlation between engine
size and the distance travelled on one litre of petrol.
Analyze the correlation coefficient and determine the best fit line for your data. Understand the relationship between variables and predict future outcomes accurately. This process involves calculating the correlation coefficient value and fitting a line that represents the data trend. By interpreting these results, you can make informed decisions and gain valuable insights from your data analysis.

Download Presentation

Please find below an Image/Link to download the presentation.
The content on the website is provided AS IS for your information and personal use only. It may not be sold, licensed, or shared on other websites without obtaining consent from the author.If you encounter any issues during the download, it is possible that the publisher has removed the file from their server.
You are allowed to download the files provided on this website for personal or commercial use, subject to the condition that they are used lawfully. All files are the property of their respective owners.
The content on the website is provided AS IS for your information and personal use only. It may not be sold, licensed, or shared on other websites without obtaining consent from the author.
E N D
Presentation Transcript
Finding Correlation Coefficient & Line of Best Fit
Finding Correlation Coefficient Find the Correlation Coefficient for the following data We want to M CLR the calculator to Clear its Memory 9.4 8.6 4.5 3.0 5.2 5.0 2.1 0 0 1.2 3.2 Rainfall (x cm) 5.0 8.0 0.8 4.2 4.8 7.4 2.6 No. of tourists (1000 s Finding Correlation Coefficient
4.5 3.0 5.2 5.0 2.1 0 0 1.2 3.2 Rainfall (x cm) 5.0 8.0 0.8 4.2 4.8 7.4 9.4 8.6 2.6 No. of tourists (1000 s We want to M CLR the calculator to Clear its Memory Finding Correlation Coefficient
4.5 3.0 5.2 5.0 2.1 0 0 1.2 3.2 Rainfall (x cm) 5.0 8.0 0.8 4.2 4.8 7.4 9.4 8.6 2.6 No. of tourists (1000 s We want the calculator in STATS mode Finding Correlation Coefficient
4.5 3.0 5.2 5.0 2.1 0 0 1.2 3.2 Rainfall (x cm) 5.0 8.0 0.8 4.2 4.8 7.4 9.4 8.6 2.6 No. of tourists (1000 s We want to find a LINE linking the points Finding Correlation Coefficient
4.5 3.0 5.2 5.0 2.1 0 0 1.2 3.2 Rainfall (x cm) 5.0 8.0 0.8 4.2 4.8 7.4 9.4 8.6 2.6 No. of tourists (1000 s Enter each pair of points separated by a comma Repeat the process entering all the Data in the table Pressing DATA afterwards Finding Correlation Coefficient
4.5 3.0 5.2 5.0 2.1 0 0 1.2 3.2 Rainfall (x cm) 5.0 8.0 0.8 4.2 4.8 7.4 9.4 8.6 2.6 No. of tourists (1000 s We want the Correlation Coefficient r Its in Green so press ALPHA first The Correlation Coefficient = -0.775947983 Finding Correlation Coefficient
4.5 3.0 5.2 5.0 2.1 0 0 1.2 3.2 Rainfall (x cm) 5.0 8.0 0.8 4.2 4.8 7.4 9.4 8.6 2.6 No. of tourists (1000 s Line of Best Fit Y = a + bx a = 8.66 b b = -1.12 Y = 8.66 1.12x Finding Correlation Coefficient
Questions 1. The marks of 7 pupils in two Maths papers are as follows : Paper 1 20 32 40 60 71 80 91 Paper 2 15 25 40 50 64 75 84 Plot the marks on a scatter graph. (Paper 1 marks on the horizontal axis and Paper 2 marks on the vertical axis) a) b) Is there any correlation between the marks on Paper 1 and Paper 2 ? c) Use your calculator to find the Correlation coefficient d) Find the equation of the Line of Best Fit for the data e) Eve achieves a score of 6 on Test A. Use the line of best fit to give an estimate of her score on Test B. Objective : To practise stating correlation.
Answers 1. Yes there is positive correlation between Paper1 and Paper 2. Test Scores 100 80 60 Paper 2 40 20 0 0 20 40 60 80 100 Paper 1
2. the engine size of a car in litres and the distance it travelled in km on one litre of petrol. Top Gear want to know if there is any correlation between engine size and distance travelled. Engine 0.8 1.6 Distance 13 10.2 a) Plot the marks on a scatter graph. b) Is there any correlation between the Engine Size and Distance Top Gear are doing a review of cars. The table below shows 2.6 5.4 12 1 2.1 7.8 1.3 11.2 1.8 8.5 c) Use your calculator to find the Correlation coefficient d) Find the equation of the Line of Best Fit for the data e) A car has a 2.3 litre engine. How far would you expect it to go on one litre of petrol ?
Answers2. Yes there is negative correlation between engine size and the distance travelled on one litre of petrol. Size of Engine & Distance Travelled 14 12 Distance Travelled . on one litre (km) 10 8 6 4 2 0 0 500 1000 1500 2000 2500 3000 Engine size (ml)