Best Fit Lines in Data Analysis
Exploring the concept of best fit lines in data analysis, this lesson covers how to determine a line of best fit from a scatter plot, interpret the slope and intercept of the line, and fit linear functions to data points. Through examples and steps, students learn to graph data, find the equation of the line of best fit, and understand the significance of slope and intercept in data analysis.

Download Presentation

Please find below an Image/Link to download the presentation.
The content on the website is provided AS IS for your information and personal use only. It may not be sold, licensed, or shared on other websites without obtaining consent from the author.If you encounter any issues during the download, it is possible that the publisher has removed the file from their server.
You are allowed to download the files provided on this website for personal or commercial use, subject to the condition that they are used lawfully. All files are the property of their respective owners.
The content on the website is provided AS IS for your information and personal use only. It may not be sold, licensed, or shared on other websites without obtaining consent from the author.
E N D
Presentation Transcript
Lesson 4.6 Best Fit Line Concept: Using & Interpreting Best Fit Lines EQs: -How do we determine a line of best fit from a scatter plot? (S.ID.6 a,c) -What does the slope and intercept tell me about the data? (S.ID.7) Vocabulary: Scatter Plot, Slope, Intercept, Line of best fit 1 4.2.4: Fitting Linear Functions to Data
Dear Teacher On a sheet of paper, write to your teacher what you know about best fit lines and what you hope to learn after today s lesson. 4.2.4: Fitting Linear Functions to Data 2
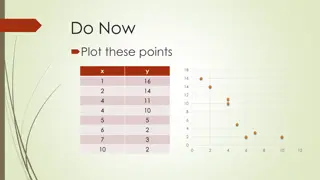
Before you can find the line of best fit .. Graph your data Determine if the data can be represented using a linear model does the data look linear??? Draw a line through the data that is close to most points. Some values should be above the line and some values should be below the line. Now you can write the equation of the line. Let s try one together. 4.2.4: Fitting Linear Functions to Data 3
Pablos science class is growing plants. He recorded the height of his plant each day for 10 days. The plant s height, in cm, over time is in the scatter plot. 4 4.2.4: Fitting Linear Functions to Data
GO Best Fit Line Steps 1. Identify two points on the line of best fit Example (7, 14), (8, 16) 4.2.4: Fitting Linear Functions to Data 5
GO Best Fit Line Steps 1. Identify two points on the line of best fit Example (7, 14), (8, 16) m = 16 14 8 7=2 1= 2 2. Find the slope of the line using the points 4.2.4: Fitting Linear Functions to Data 6
GO Best Fit Line Steps 1. Identify two points on the line of best fit Example (7, 14), (8, 16) m = 16 14 8 7=2 1= 2 2. Find the slope of the line using the points y = 2(x 7) + 14 3. Substitute into y = m(x x1) + y1 4.2.4: Fitting Linear Functions to Data 7
GO Best Fit Line Steps 1. Identify two points on the line of best fit Example (7, 14), (8, 16) m = 16 14 8 7=2 1= 2 2. Find the slope of the line using the points y = 2(x 7) + 14 3. Substitute into y = m(x x1) + y1 y = 2x 14 +14 y = 2x 4. Simplify 4.2.4: Fitting Linear Functions to Data 8
(Write this below your GO) Interpret the slope and y-intercept ? = 2? Slope value: ____ Slope units: _______ Y-intercept value: ____ Y-intercept unit: ______ Interpretation: ___________________ ____________________ ___________________ 9 4.2.4: Fitting Linear Functions to Data
Guided Practice Example 1 A weather team records the weather each hour after sunrise one morning in May. The hours after sunrise and the temperature in degrees Fahrenheit are in the table to the right. Can the temperature 0 7 hours after sunrise be represented by a linear function? If yes, find the equation of the function. Graph the points!!! Hours after sunrise 0 1 2 3 4 5 6 7 Temperature in F 52 53 56 57 60 63 64 67 10 4.2.4: Fitting Linear Functions to Data
Guided Practice: Example 1, continued 1. Create a scatter plot of the data. Let the x-axis represent hours after sunrise and the y-axis represent the temperature in degrees Fahrenheit. F) Temperature ( Hours after sunrise 11 4.2.4: Fitting Linear Functions to Data
Guided Practice: Example 1, continued 2. Determine if the data can be represented by a linear function. The graph of a linear equation is a line. If the data looks like it could fit a line, then a linear equation could be used to represent the data. The temperatures appear to increase in a line, and a linear equation could be used to represent the data set. 12 4.2.4: Fitting Linear Functions to Data
Guided Practice: Example 1, continued 3. Draw a line to estimate the data set. Two points in the data set can be used to draw a line that estimates that data. When the line is drawn, some of the data values should be above the line, and some should be below the line. A line through (2, 56) and (6, 64) looks like a good fit for the data. 13 4.2.4: Fitting Linear Functions to Data
Guided Practice: Example 1, continued F) Temperature ( 14 Hours after sunrise 4.2.4: Fitting Linear Functions to Data
GO Best Fit Line Steps Example 1. 2. 3. 4.
GO Best Fit Line Steps 1. Identify two points on the line of best fit Example (2, 56), (6, 64) 2. 3. 4. 4.2.4: Fitting Linear Functions to Data 16
GO Best Fit Line Steps 1. Identify two points on the line of best fit Example (2, 56), (6, 64) m = 64 56 =8 4= 2 2. Find the slope of the line using the points 6 2 3. 4. 4.2.4: Fitting Linear Functions to Data 17
GO Best Fit Line Steps 1. Identify two points on the line of best fit Example (2, 56), (6, 64) m = 64 56 =8 4= 2 2. Find the slope of the line using the points 6 2 y = 2(x 2) + 56 3. Substitute into y = m(x x1) + y1 4. 4.2.4: Fitting Linear Functions to Data 18
GO Best Fit Line Steps 1. Identify two points on the line of best fit Example (2, 56), (6, 64) m = 64 56 =8 4= 2 2. Find the slope of the line using the points 6 2 y = 2(x 2) + 56 3. Substitute into y = m(x x1) + y1 y = 2x 4 +56 y = 2x +52 4. Simplify 4.2.4: Fitting Linear Functions to Data 19
Interpret the slope and y-intercept ? = 2? + 52 Slope value: ____ Slope units: _______ Y-intercept value: ______ Y-intercept unit: ________ Interpretation: ______________________ __________________________________ 20 4.2.4: Fitting Linear Functions to Data
Guided Practice - Example 2 Can the speed between 0 and 8 seconds be represented by a linear function? If yes, find the equation of the function. 21 4.2.4: Fitting Linear Functions to Data
Guided Practice: Example 2, continued 1. Create a scatter plot of the data. Let the x-axis represent time and the y-axis represent speed. 22 4.2.4: Fitting Linear Functions to Data
Guided Practice: Example 2, continued 2. Determine if the data can be represented by a linear function. 23 4.2.4: Fitting Linear Functions to Data
Guided Practice - Example 3 Automated tractors can mow lawns without being driven by a person. A company runs trials using fields of different sizes, and records the amount of time it takes the tractor to mow each field. The field sizes are measured in acres. Time in hours 15 10 22 32.3 46.8 34 39.6 75 70 112 Acres 5 7 10 17 18 20 22 25 30 40 Can the time to mow acres of a field be represented by a linear function? If yes, find the equation of the function. 24 4.2.4: Fitting Linear Functions to Data
Guided Practice: Example 3, continued 1. Create a scatter plot of the data. Let the x-axis represent the acres and the y-axis represent the time in hours. Time 25 Acres 4.2.4: Fitting Linear Functions to Data
Guided Practice: Example 3, continued 2. Determine if the data can be represented by a linear function. The graph of a linear equation is a line. If the data looks like it could fit a line, then a linear equation could be used to represent the data. The time appears to increase in a line, and a linear equation could be used to represent the data set. 26 4.2.4: Fitting Linear Functions to Data
Guided Practice: Example 3, continued 3. Draw a line to estimate the data set. Two points in the data set can be used to draw a line that estimates the data. When the line is drawn, some of the data values should be above the line, and some should be below the line. A line through (7, 10) and (40, 112) looks like a good fit for the data. 27 4.2.4: Fitting Linear Functions to Data
Guided Practice: Example 3, continued Time 28 Acres 4.2.4: Fitting Linear Functions to Data
GO Best Fit Line Steps Example 1. 2. 3. 4.
GO Best Fit Line Steps 1. Identify two points on the line of best fit Example (7, 10) and (40, 112) 2. 3. 4. 4.2.4: Fitting Linear Functions to Data 30
GO Best Fit Line Steps 1. Identify two points on the line of best fit Example (7, 10) and (40, 112) m = 112 10 =102 33=3.09 2. Find the slope of the line using the points 40 7 3. 4. 4.2.4: Fitting Linear Functions to Data 31
GO Best Fit Line Steps 1. Identify two points on the line of best fit Example (7, 10) and (40, 112) m = 112 10 =102 33=3.09 2. Find the slope of the line using the points 40 7 y = 3.09(x 7) + 10 3. Substitute into y = m(x x1) + y1 4. 4.2.4: Fitting Linear Functions to Data 32
GO Best Fit Line Steps 1. Identify two points on the line of best fit Example (7, 10) and (40, 112) m = 112 10 =102 33=3.09 2. Find the slope of the line using the points 40 7 y = 3.09(x 7) + 10 3. Substitute into y = m(x x1) + y1 y = 3.09x 21.63 + 10 y = 3.09x 11.63 4. Simplify 4.2.4: Fitting Linear Functions to Data 33
Interpret the slope and y-intercept ? = 3.09? 11.63 Slope value: ____ Slope units: _______ Y-intercept value: ______ Y-intercept unit: ________ Interpretation: ______________________ __________________________________ 34 4.2.4: Fitting Linear Functions to Data
Resource http://www.shodor.org/interactivate/activities/Regression/ 35
The Important Thing On a sheet of paper, write down three things you learned today. Out of those three, write which one is most important and why. 36


")