Measures of Linear Relationship in Statistics
Chapter 3
Numerical Descriptive Techniques
III
Chapters
1. Introduction
2. Graphs
3. Descriptive statistics
4. Basic probability
5. Discrete distributions
6. Continuous distributions
7. Central limit theorem
8. Estimation
9. Hypothesis testing
10. Two-sample tests
13. Linear regression
14. Multivariate regression
Two Variables, Linear Relationship
9/18/2024
Towson University - J. Jung
4.2
Measures of Linear Relationship
•
If we plot variable pairs, how close to a straight line will our
plot look?
•
Two measures providing information as to the
strength &
direction
of a linear relationship between two variables.
•
Covariance
and
Correlation
Coefficient
(called
Coefficient
of Correlation
in textbook).
Covariance
- is there any
pattern
to the way two variables move
together?
Correlation Coefficient
- how
strong
is the linear relationship
between two variables?
9/18/2024
Towson University - J. Jung
4.3
Covariance
9/18/2024
Towson University - J. Jung
4.4
population mean of variable X, variable Y
sample mean of variable X, variable Y
Note: divisor is n-1, not n as you may expect.
Covariance…
•
In much the same way there was a “shortcut” for
calculating sample variance without having to
calculate the sample mean, there is also a shortcut
for calculating sample covariance without having to
first calculate the mean:
9/18/2024
Towson University - J. Jung
4.5
Covariance Illustrated
•
Consider the following three sets of data:
(textbook
§
4.5)…
9/18/2024
Towson University - J. Jung
4.6
•
In each set, the values of X are the same, and the value for Y are the same;
the only thing that’s changed is the order of the Y’s.
•
In set #1, as X increases so does Y; S
xy
is large & positive
•
In set #2, as X increases, Y decreases; S
xy
is large & negative
•
In set #3, as X increases, Y doesn’t move in any particular way; S
xy
is “small”
9/18/2024
Towson University - J. Jung
4.7
X
Y
2
13
6
7
17
+
+
-
-
Covariance… (Generally speaking)
•
When two variables move in the
same direction
(both
increase or both decrease), the covariance will be a
large
positive number
.
•
When two variables move in
opposite directions
, the
covariance is a
large negative number
.
•
When there is
no particular pattern
, the covariance is a
small number
.
•
However, it’s difficult to interpret
Covariance
.
•
Units are not meaningful.
•
Size of covariance depends on the scale of variable, so that
the comparison of relative strength is virtually impossible.
9/18/2024
Towson University - J. Jung
4.8
Correlation Coefficient
•
Correlation Coefficient
is defined as the covariance
divided by the standard deviations of the variables:
9/18/2024
Towson University - J. Jung
4.9
Greek letter
“rho”
•
This coefficient answers the question:
How
strong
is the association between X and Y?
Statistics is a pattern language…
9/18/2024
Towson University - J. Jung
4.10
Correlation Coefficient
•
Correlation Coefficient
is “
standardized
”
covariance,
free
of unit.
•
The advantage of the correlation coefficient over
covariance is that it has fixed range from -1 to +1, thus:
–
If the two variables are very strongly positively related, the
coefficient value is
close
to +1 (
strong
positive linear
relationship).
–
If the two variables are very strongly negatively related, the
coefficient value is
close
to -1 (
strong
negative linear
relationship).
–
No straight line relationship is indicated by a coefficient close to
zero.
9/18/2024
Towson University - J. Jung
4.11
Coefficient of Correlation…
9/18/2024
Towson University - J. Jung
4.12
or r =
+1
0
-1
Strong positive linear relationship
No linear relationship
Strong negative linear relationship
Example 4.16
9/18/2024
Towson University - J. Jung
4.13
Because we’ve already calculated the covariances we only need
compute the standard deviations of X and Y.
Example 4.16
The standard deviations are
The coefficients of correlation are
Set 1:
Set 2:
Set 3:
9/18/2024
Towson University - J. Jung
4.14
Excel and Covariance
•
Both, the excel command
=covar(Array1,Array2)
as well as
Covariance
in the data analysis toolpak
calculate the population covariance .
•
To transform the population covariance into
the sample covariance adjust by multiplying
with N/(n-1):
•
9/18/2024
Towson University - J. Jung
4.15
Correlation Coefficient (Application)
•
Consider
Example 4.16
, where MBA grade point averages are
compared with GMAT scores. Is the GMAT score a good
predictor of MBA success?
9/18/2024
Towson University - J. Jung
4.16
Excel:
Tools > Data Analysis… > Covariance
Tools > Data Analysis… > Correlation
This is the population covariance!!
GMAT & GPA Interpretation…
•
The population covariance is 23.89 and the correlation coefficient
is .5354.
•
These two statistics tell us that there is a
positive linear
relationship
between GMAT score and GPA.
•
The coefficient of correlation tells us that the linear relationship is
“moderately” strong.
9/18/2024
Towson University - J. Jung
4.17
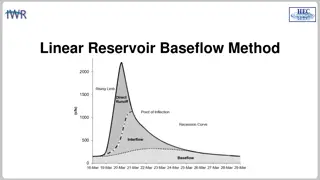
Least Squares Method
•
The objective of the scatter diagram is to measure
the strength and direction of the linear relationship.
•
Both can be more easily judged by drawing a
straight line through the data.
•
We need an objective method of producing a
straight line.
•
Such a method has been developed; it is called
the least squares method.
9/18/2024
Towson University - J. Jung
4.18
Causation
•
Change in independent variable (explanatory
variable) directly causes change in dependent
variable (response variable).
•
If we’ve determined there is a linear relationship
between two variables with covariance and the
correlation coefficient, can we determine a linear
function of the relationship?
•
If we have good reason to suspect a
causal
relationship
, we can create a model more
informative and more powerful than covariance
or correlation.
9/18/2024
Towson University - J. Jung
4.19
Least Squares Method…
•
Recall, the slope-intercept equation for a line is
expressed in these terms:
y =
b1*
x +
b0
•
Where:
–
b1
is the slope of the line
–
b0
is the y-intercept.
•
If we’ve determined there is a linear relationship
between two variables with covariance and the
coefficient of correlation, can we determine a linear
function of the relationship?
9/18/2024
Towson University - J. Jung
4.20
The Least Squares Method…
•
…produces a straight line drawn through the points
so that the sum of squared deviations between the
points and the line is minimized. This line is
represented by the equation:
9/18/2024
Towson University - J. Jung
4.21
b
0
(“b” naught) is the y-intercept,
b
1
is the slope, and
(“y” hat) is predicted y determined by the line.
Least Squares Line
•
Line that minimizes the sum of squared
deviations from the mean.
Y
X
run
rise
=slope (=rise/run)
=y-intercept
9/18/2024
22
Towson University - J. Jung
b1
b0
Y = b1*X + b0
d1^2
d2^2
d3^2
The Least Squares Method…
The coefficients b
0
and b
1
are given by:
9/18/2024
Towson University - J. Jung
4.23
Then get the intercept, as:
Least Squares Line…
•
Find the least squares line for the previous example (e.g. MBA
/ GMAT).
9/18/2024
Towson University - J. Jung
4.24
Least Squares Line…
9/18/2024
Towson University - J. Jung
4.25
Example: Fixed and Variable Costs
•
Fixed costs are costs that must be paid
whether or not any units are produced.
•
These costs are "fixed" over a specified
period of time or range of production.
•
Variable costs are costs that vary directly
with the number of products produced.
9/18/2024
Towson University - J. Jung
4.26
Fixed and Variable Costs
•
There are some expenses that are mixed.
•
There are several ways to break the mixed costs in its fixed and
variable components. One such method is the least squares line.
That is, we express the total costs of some component as
y = b
0
+ b
1
x
–
where y = total mixed cost,
–
b
0
= fixed cost and
–
b
1
= variable cost, and
–
x is the number of units.
9/18/2024
Towson University - J. Jung
4.27
Example 4.17
•
A tool and die maker operates out of a small shop making
specialized tools.
•
He is considering increasing the size of his business and
needed to know more about his costs.
•
One such cost is electricity, which he needs to operate his
machines and lights. (Some jobs require that he turn on extra
bright lights to illuminate his work.)
•
He keeps track of his daily electricity costs and the number of
tools that he made that day.
•
Determine the fixed and variable electricity costs.
9/18/2024
Towson University - J. Jung
4.28
Example 4.17
9/18/2024
Towson University - J. Jung
4.29
Example 4.17
•
The slope is defined as rise/run, which means that it is the change
in y (rise) for a 1-unit increase in x (run).
•
The slope measures the
marginal
rate of change in the dependent
variable. The marginal rate of change refers to the effect of
increasing the independent variable by one additional unit.
•
In this example the slope is 2.25, which means that for each 1-unit
increase in the number of tools, the marginal increase in the
electricity cost 2.25.
•
Thus, the estimated variable cost is $2.25 per tool.
9/18/2024
Towson University - J. Jung
4.30
Example 4.17
•
The y-intercept is 9.59. That is, the line strikes
the y-axis at 9.59.
•
This is simply the value of when x = 0.
•
However, when x = 0 we are producing no
tools and hence the estimated fixed cost of
electricity is $9.59 per day.
9/18/2024
Towson University - J. Jung
4.31
Coefficient of Determination
•
When we introduced the coefficient of correlation we pointed
out that except for −1, 0, and +1 we cannot precisely interpret its
meaning.
•
We can judge the coefficient of correlation in relation to its
proximity to −1, 0, and +1 only.
•
Fortunately, we have another measure that can be precisely
interpreted.
•
It is the
coefficient of determination
, which is calculated by
squaring the coefficient of correlation. For this reason we denote
it R
2
.
–
The coefficient of determination measures the amount of variation in
the dependent variable that is explained by the variation in the
independent variable.
9/18/2024
Towson University - J. Jung
4.32
Example 4.18
•
Calculate the coefficient of determination for
Example 4.17
9/18/2024
Towson University - J. Jung
4.33
Example 4.18
•
The coefficient of determination is
R
2
= .758
•
This tells us that 75.8% of the variation in
electrical costs is explained by the number of
tools.
•
The remaining 24.2% is unexplained.
9/18/2024
Towson University - J. Jung
4.34
Interpreting Correlation
(or Determination)
•
Because of its importance we remind you
about the correct interpretation of the
analysis of the relationship between two
interval variables.
•
That is, if two variables are linearly related it
does not mean that X is causing Y.
•
It may mean that another variable is causing
both X and Y or that Y is causing X.
•
Remember “Correlation is not Causation”
9/18/2024
Towson University - J. Jung
4.35
Keller: Stats for Mgmt & Econ, 7th Ed
Copyright © 2006 Brooks/Cole, a division of Thomson Learning, Inc.
Exploring the concepts of covariance and correlation coefficient in statistics to determine the strength and direction of linear relationships between variables. Covariance indicates the pattern two variables move together, while correlation coefficient quantifies the strength of the relationship. Shortcuts for calculating covariance are discussed along with examples illustrating how covariance values change based on the relationship direction.

Download Presentation

Please find below an Image/Link to download the presentation.
The content on the website is provided AS IS for your information and personal use only. It may not be sold, licensed, or shared on other websites without obtaining consent from the author.If you encounter any issues during the download, it is possible that the publisher has removed the file from their server.
You are allowed to download the files provided on this website for personal or commercial use, subject to the condition that they are used lawfully. All files are the property of their respective owners.
The content on the website is provided AS IS for your information and personal use only. It may not be sold, licensed, or shared on other websites without obtaining consent from the author.
E N D
Presentation Transcript
Chapters 1. Introduction 2. Graphs 3. Descriptive statistics 4. Basic probability 5. Discrete distributions 6. Continuous distributions 7. Central limit theorem 8. Estimation 9. Hypothesis testing 10. Two-sample tests 13. Linear regression 14. Multivariate regression Chapter 3 Numerical Descriptive Techniques III
Two Variables, Linear Relationship 9/18/2024 Towson University - J. Jung 4.2
Measures of Linear Relationship If we plot variable pairs, how close to a straight line will our plot look? Two measures providing information as to the strength & direction of a linear relationship between two variables. Covariance and CorrelationCoefficient (called Coefficient of Correlation in textbook). Covariance - is there any pattern to the way two variables move together? Correlation Coefficient - how strong is the linear relationship between two variables? 9/18/2024 Towson University - J. Jung 4.3
Covariance population mean of variable X, variable Y sample mean of variable X, variable Y Note: divisor is n-1, not n as you may expect. 9/18/2024 Towson University - J. Jung 4.4
Covariance In much the same way there was a shortcut for calculating sample variance without having to calculate the sample mean, there is also a shortcut for calculating sample covariance without having to first calculate the mean: 9/18/2024 Towson University - J. Jung 4.5
Covariance Illustrated Consider the following three sets of data: (textbook 4.5) In each set, the values of X are the same, and the value for Y are the same; the only thing that s changed is the order of the Y s. In set #1, as X increases so does Y; Sxy is large & positive In set #2, as X increases, Y decreases; Sxy is large & negative In set #3, as X increases, Y doesn t move in any particular way; Sxyis small 9/18/2024 Towson University - J. Jung 4.6
Y - + 17 = 20 Y - + 13 2 = 5 X 7 6 X 9/18/2024 Towson University - J. Jung 4.7
Covariance (Generally speaking) When two variables move in the same direction (both increase or both decrease), the covariance will be a large positive number. When two variables move in opposite directions, the covariance is a large negative number. When there is no particular pattern, the covariance is a small number. However, it s difficult to interpret Covariance. Units are not meaningful. Size of covariance depends on the scale of variable, so that the comparison of relative strength is virtually impossible. 9/18/2024 Towson University - J. Jung 4.8
Correlation Coefficient Correlation Coefficient is defined as the covariance divided by the standard deviations of the variables: Greek letter rho This coefficient answers the question: How strong is the association between X and Y? 9/18/2024 Towson University - J. Jung 4.9
Statistics is a pattern language Population Sample n N Size Mean S2 Variance Standard Deviation Coefficient of Variation S CV cv Sxy r Covariance Coefficient of Correlation 9/18/2024 Towson University - J. Jung 4.10
Correlation Coefficient Correlation Coefficientis standardized covariance, free of unit. The advantage of the correlation coefficient over covariance is that it has fixed range from -1 to +1, thus: If the two variables are very strongly positively related, the coefficient value is close to +1 (strong positive linear relationship). If the two variables are very strongly negatively related, the coefficient value is close to -1 (strong negative linear relationship). No straight line relationship is indicated by a coefficient close to zero. 9/18/2024 Towson University - J. Jung 4.11
Coefficient of Correlation Strong positive linear relationship +1 or r = No linear relationship 0 Strong negative linear relationship -1 9/18/2024 Towson University - J. Jung 4.12
Example 4.16 Because we ve already calculated the covariances we only need compute the standard deviations of X and Y. + + = 2 6 7 = x 0 . 5 3 + + 13 20 27 = = y 20 0 . 3 2 2 2 ) 5 + + ) 5 + + 2 ( 6 ( ) 5 7 ( 9 1 4 2 x = = = s 0 . 7 3 1 2 2 2 2 + + + + 13 ( 20 ) ( 20 20 ) ( 27 20 ) 49 01 49 2 y = = = s 49 0 . 3 1 2 9/18/2024 Towson University - J. Jung 4.13
Example 4.16 The standard deviations are = = = = sx 0 . 7 . 2 65 sy 49 0 . . 7 00 The coefficients of correlation are s r y x 17 5 . xy = = = . 943 Set 1: s s . 2 ( 65 ) 0 . 7 )( s 17 5 . xy = = = r . 943 Set 2: s s . 2 ( 65 ) 0 . 7 )( x y s 5 . 3 xy = = = r . 189 Set 3: s s . 2 ( 65 ) 0 . 7 )( x y 9/18/2024 Towson University - J. Jung 4.14
Excel and Covariance Both, the excel command =covar(Array1,Array2) as well as Covariance in the data analysis toolpak calculate the population covariance . To transform the population covariance into the sample covariance adjust by multiplying with N/(n-1): 1 n XY N = s XY XY 9/18/2024 Towson University - J. Jung 4.15
Correlation Coefficient (Application) Consider Example 4.16, where MBA grade point averages are compared with GMAT scores. Is the GMAT score a good predictor of MBA success? Gmat GPA 599 9.6 689 8.8 584 7.4 631 10 595 7.8 643 9.2 656 9.6 594 8.4 710 11.2 611 7.6 593 8.8 683 8 This is the population covariance!! Excel: Tools > Data Analysis > Covariance Tools > Data Analysis > Correlation Gmat GPA Gmat 1733.222 GPA 23.89444 1.148889 9/18/2024 Towson University - J. Jung 4.16
GMAT & GPA Interpretation Gmat 1733.222 GPA Gmat GPA 23.89444 1.148889 Gmat GPA Gmat 1 GPA 0.535465 1 The population covariance is 23.89 and the correlation coefficient is .5354. These two statistics tell us that there is a positive linear relationship between GMAT score and GPA. The coefficient of correlation tells us that the linear relationship is moderately strong. 9/18/2024 Towson University - J. Jung 4.17
Least Squares Method The objective of the scatter diagram is to measure the strength and direction of the linear relationship. Both can be more easily judged by drawing a straight line through the data. We need an objective method of producing a straight line. Such a method has been developed; it is called the least squares method. 9/18/2024 Towson University - J. Jung 4.18
Causation Change in independent variable (explanatory variable) directly causes change in dependent variable (response variable). If we ve determined there is a linear relationship between two variables with covariance and the correlation coefficient, can we determine a linear function of the relationship? If we have good reason to suspect a causal relationship, we can create a model more informative and more powerful than covariance or correlation. 9/18/2024 Towson University - J. Jung 4.19
Least Squares Method Recall, the slope-intercept equation for a line is expressed in these terms: y = b1*x + b0 Where: b1 is the slope of the line b0 is the y-intercept. If we ve determined there is a linear relationship between two variables with covariance and the coefficient of correlation, can we determine a linear function of the relationship? 9/18/2024 Towson University - J. Jung 4.20
The Least Squares Method produces a straight line drawn through the points so that the sum of squared deviations between the points and the line is minimized. This line is represented by the equation: b0( b naught) is the y-intercept, b1 is the slope, and ( y hat) is predicted y determined by the line. 9/18/2024 Towson University - J. Jung 4.21
Least Squares Line Line that minimizes the sum of squared deviations from the mean. Y Y = b1*X + b0 rise run =slope (=rise/run) b1 d1^2 d3^2 b0 d2^2 =y-intercept X 9/18/2024 Towson University - J. Jung 22
The Least Squares Method The coefficients b0 and b1 are given by: Then get the intercept, as: 9/18/2024 Towson University - J. Jung 4.23
Least Squares Line Find the least squares line for the previous example (e.g. MBA / GMAT). 89 . 23 , 1 12 79 . s 11 = = = X 2 Y 01379 . 0 b 1890 s X = , b = y b x 0 1 . 8 867 01379 . 0 632 33 . = . 0 1492 : Line = is + y . 0 1492 01379 . 0 x 9/18/2024 Towson University - J. Jung 4.24
Least Squares Line GPA 12 10 8 GPA y = 0.0138x + 0.1492 R = 0.2867 6 Linear (GPA) 4 2 0 0 100 200 300 400 500 600 700 800 9/18/2024 Towson University - J. Jung 4.25
Example: Fixed and Variable Costs Fixed costs are costs that must be paid whether or not any units are produced. These costs are "fixed" over a specified period of time or range of production. Variable costs are costs that vary directly with the number of products produced. 9/18/2024 Towson University - J. Jung 4.26
Fixed and Variable Costs There are some expenses that are mixed. There are several ways to break the mixed costs in its fixed and variable components. One such method is the least squares line. That is, we express the total costs of some component as y = b0 + b1x where y = total mixed cost, b0 = fixed cost and b1 = variable cost, and x is the number of units. 9/18/2024 Towson University - J. Jung 4.27
Example 4.17 A tool and die maker operates out of a small shop making specialized tools. He is considering increasing the size of his business and needed to know more about his costs. One such cost is electricity, which he needs to operate his machines and lights. (Some jobs require that he turn on extra bright lights to illuminate his work.) He keeps track of his daily electricity costs and the number of tools that he made that day. Determine the fixed and variable electricity costs. 9/18/2024 Towson University - J. Jung 4.28
Example 4.17 50.00 45.00 y = 2.245x + 9.587 40.00 35.00 Electrical costs 30.00 25.00 20.00 15.00 10.00 5.00 0.00 0 2 4 6 8 10 12 14 16 Number of tools 9/18/2024 Towson University - J. Jung 4.29
Example 4.17 + = y . 9 587 . 2 245 x The slope is defined as rise/run, which means that it is the change in y (rise) for a 1-unit increase in x (run). The slope measures the marginal rate of change in the dependent variable. The marginal rate of change refers to the effect of increasing the independent variable by one additional unit. In this example the slope is 2.25, which means that for each 1-unit increase in the number of tools, the marginal increase in the electricity cost 2.25. Thus, the estimated variable cost is $2.25 per tool. 9/18/2024 Towson University - J. Jung 4.30
Example 4.17 = + y . 9 59 . 2 25 x The y-intercept is 9.59. That is, the line strikes the y-axis at 9.59. This is simply the value of when x = 0. However, when x = 0 we are producing no tools and hence the estimated fixed cost of electricity is $9.59 per day. 9/18/2024 Towson University - J. Jung 4.31
Coefficient of Determination When we introduced the coefficient of correlation we pointed out that except for 1, 0, and +1 we cannot precisely interpret its meaning. We can judge the coefficient of correlation in relation to its proximity to 1, 0, and +1 only. Fortunately, we have another measure that can be precisely interpreted. It is the coefficient of determination, which is calculated by squaring the coefficient of correlation. For this reason we denote it R2 . The coefficient of determination measures the amount of variation in the dependent variable that is explained by the variation in the independent variable. 9/18/2024 Towson University - J. Jung 4.32
Example 4.18 Calculate the coefficient of determination for Example 4.17 50.00 45.00 y = 2.245x + 9.587 R = 0.758 40.00 35.00 Electrical costs 30.00 25.00 20.00 15.00 10.00 5.00 0.00 0 2 4 6 8 10 12 14 16 Number of tools 9/18/2024 Towson University - J. Jung 4.33
Example 4.18 The coefficient of determination is R2 = .758 This tells us that 75.8% of the variation in electrical costs is explained by the number of tools. The remaining 24.2% is unexplained. 9/18/2024 Towson University - J. Jung 4.34
Interpreting Correlation (or Determination) Because of its importance we remind you about the correct interpretation of the analysis of the relationship between two interval variables. That is, if two variables are linearly related it does not mean that X is causing Y. It may mean that another variable is causing both X and Y or that Y is causing X. Remember Correlation is not Causation 9/18/2024 Towson University - J. Jung 4.35


")


")