Exploring the Causes of Seasons Through Data and Models
Explore the concept of seasons through data analysis of average daily temperatures in tourist cities, observations using planetarium software, true color images of Earth's changes through the seasons, and hands-on modeling activities. Discover how the tilt of the Earth's axis and its orbit around the Sun influence the changing seasons we experience.
Download Presentation

Please find below an Image/Link to download the presentation.
The content on the website is provided AS IS for your information and personal use only. It may not be sold, licensed, or shared on other websites without obtaining consent from the author. Download presentation by click this link. If you encounter any issues during the download, it is possible that the publisher has removed the file from their server.
E N D
Presentation Transcript
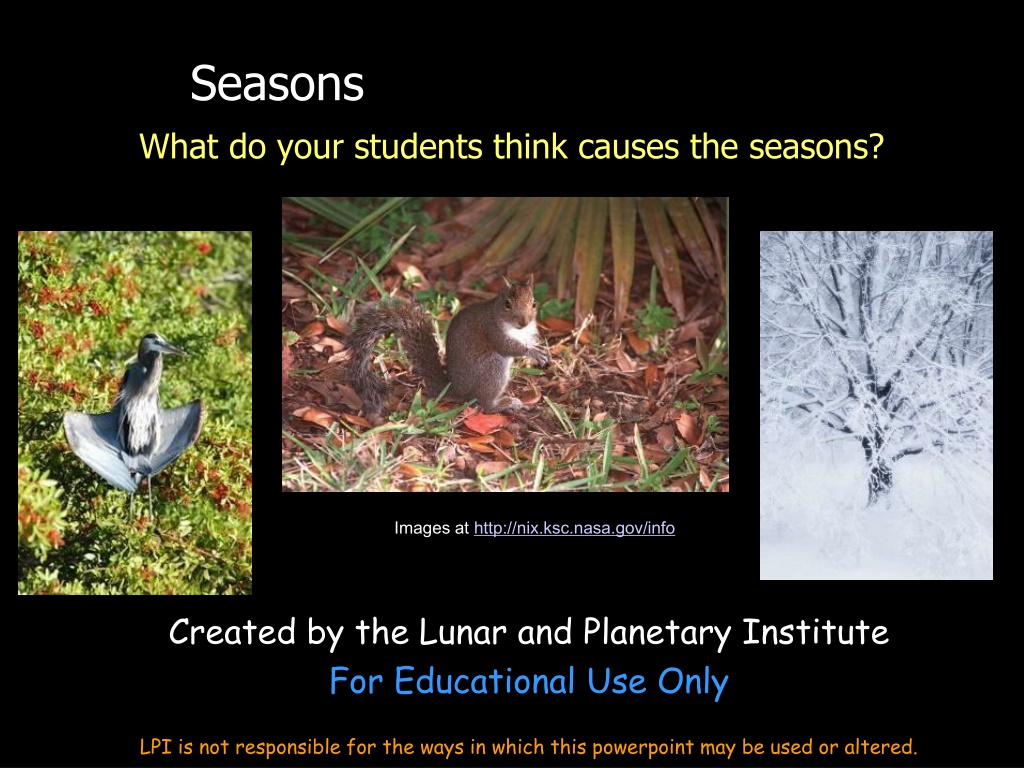
Seasons What do your students think causes the seasons? Images at http://nix.ksc.nasa.gov/info Created by the Lunar and Planetary Institute For Educational Use Only LPI is not responsible for the ways in which this powerpoint may be used or altered.
Lets start with a couple probes Snowball!
Lets Look at Some Data! Temperatures around the World
Average Daily Temperatures (F) in Tourist Cities (from http://www.infoplease.com/ipa/A0004587.html )) January April July October Cape Town (South Africa) 69 66 60 65 Caracas (Venezuela) 75 81 78 79 London (United Kingdom) 44 56 73 58 Mexico City (Mexico) 66 77 73 70 Montreal (Canada) 22 51 79 56 Moscow (Russia) 21 47 76 46 Nairobi (Kenya) 77 75 69 77 Paris (France) 42 60 76 59 San Jos (Costa Rica) 75 79 77 77 Seoul (Korea) 33 62 84 67 Singapore 86 89 87 88 Stockholm (Sweden) 31 45 70 48 Sydney (Australia) 79 73 62 72 Tokyo (Japan) 48 64 84 70
Lets Start with some Observations Using free downloaded computer program, Stellarium: http://www.stellarium.org/ Stellarium is planetarium software that shows exactly what you see when you look up at the stars. It's easy to use, and free. Let s look at sunrise & sunset, and Sun s height in the sky.
True color images December March June September Images at http://www.nasa.gov/vision/earth/features/blue_marble.html
Modeling the Seasons Time to grab a styrofoam ball and a light!
Height of Sun for USA Winter: The Sun rises in the southeast, stays low in the sky, and sets in the southwest. Spring: The Sun rises due east, moves higher in the sky than in winter, and sets due west. Summer: The Sun rises in the northeast, travels high (near zenith), and sets in the northwest. Fall: The Sun rises due east, travels to a medium-height in the sky, and sets due west.
What Causes Earths Seasons? Earth s axis is tilted 23.5 degrees it always points in the same direction (Polaris, the North Star) as we orbit our Sun once a year This tilt causes the hemispheres to alternate in the amount of our Sun s light and heat they receive through the year Image at http://www.lpi.usra.edu/education/skytellers/seasons/about.shtml
Northern Hemisphere Summer More daylight hours, more direct sunlight Image at http://www.lpi.usra.edu/education/skytellers/seasons/about.shtml
Earths orbit is almost a perfect circle Earth is CLOSEST to our Sun (91 million miles) in winter January 3 Earth is farthest from on our Sun (94 million miles) in summer July 4
Daylight Hours Across the Globe Time is indicated as number of hours (h) Jan Feb Mar Apr May Jun Jul Aug Sep Oct Nov Dec 10.5 h 11 h 12 h 12.5 h 13 h 14 h 14.5 h 14 h 12.5 h 12.5 h 11 h 11.5 h Miami Brisbane 14.5 h 13.5 h 13.5 h 12.5 h 11 h 11 h 11 h 11.5 h 11.5 h 12.5 h 14 h 14.5 h Nairobi 12 h 12 h 12 h 12 h 12 h 12 h 12 h 12 h 12 h 12 h 12 h 12 h Punta Arenas 17.5 h 15.5 h 13.5 h 11.5 h 10 h 8.5 h 8.5 h 9.5 h 11.5 h 13 h 15 h 16.5 h Nome 5 h 7 h 10 h 13.5 h 17.5 h 21.5 h 22 h 18 h 15.5 h 11.5 h 8.5 h 5.5 h Singapore 12 h 12 h 12 h 12 h 13 h 13 h 12 h 12 h 12 h 12 h 12 h 12 h Cape Town 15 h 14 h 13.5 h 12.5 h 11.5 h 10 h 10.5 h 11 h 11.5 h 12.5 h 14 h 14 h Seattle 9 h 10 h 11 h 13.5 h 15 h 17 h 16.5 h 15.5 h 13.5 h 11.5 h 10.5 h 9.5 h 24 h 24 h 19 h 14.5 h 0 h 0 h 0 h 0 h 7 h 15 h 24 h 24 h Vostok http://www.lpi.usra.edu/education/skytellers/seasons/activities/light.shtml
Seasons on Other Planets In some cases, the changing distances from the Sun will affect the seasons. In others, the axial tilt will make a huge difference! Hubble Finds Many Bright Clouds on Uranus Image at http://photojournal.jpl.nasa.gov/catalog/PIA01589 Image at http://photojournal.jpl.nasa.gov/catalog/PIA02963
Seasons on Planets PlanetAxial Tilt Eccent. Orbit Mercury 0 Venus 177 Earth 23 Mars 25 Jupiter 3 Saturn 27 Uranus 98 Neptune 30 Perihelion Aphelion 0.21 88 days 28 mill. Miles 43 mill. miles 0.01 224 days 0.02 365 days 91 mill. miles 94 mill. miles 0.09 686 days 129 mill. miles 155 mill. miles 0.05 12 years 0.06 30 years 0.05 84 years 0.01 165 years
Mars Orbit and Seasons At vernal equinox, Mars is 145 At vernal equinox, Mars is 145 million miles from the Sun million miles from the Sun At winter solstice, Mars is 128 At winter solstice, Mars is 128 million miles from the Sun million miles from the Sun At summer solstice, Mars is 153 At summer solstice, Mars is 153 million miles from the Sun million miles from the Sun At autumnal equinox, Mars is 134 At autumnal equinox, Mars is 134 million miles from the Sun million miles from the Sun Original images from http://photojournal.jpl.nasa.gov/index.html
An Assessment Best procedures: read quietly to yourself (so you don t give any subconscious clues) As the instructor, we read it too, for timing, then ask if anyone needs more time If not, it s time to vote simultaneously use your fingers, right in front of your chest so others don t see (anonymous) Northerners have cold days in January because 1. the Earth is farthest from the Sun in January. 2. the sunlight takes a longer route to get to the Earth in January. 3. the Sun is lower in the sky in January. 4. El Nino is always strongest in January.
Another Which of the following statements help explain why summer days tend to be hotter than winter days? In that region, a) The day is longer. b) The Earth s surface receives more light per unit area. c) The light is coming more directly from the Sun. d) There is no snow to cool the Earth. 1. Just a 2. Just c 3. a and d 4. a and c 5. b and c
What would the days and seasons be like in Houston if the Earth still rotated at the same speed, but the Earth s axis were tilted nearly 50 degrees on its side instead of 23 degrees? 1. Both days and seasons would be half a year long. 2. The days would be the same length, but the seasons would be half a year long. 3. There would be no seasons, but days would be 6 months long. 4. The days and seasons would be the same lengths as ours, but the seasons would have more extreme temperature changes.
