Evolving Business Models in the 21st Century
Explore the shift from traditional 20th-century capitalism to the purpose-driven models of the 21st century. Understand the emphasis on stakeholder wellbeing, long-term value creation, and interconnected relationships with society and the environment. Discover the importance of acknowledging nested interdependencies, tracking impact points, and managing new risks in a changing global landscape.

Download Presentation

Please find below an Image/Link to download the presentation.
The content on the website is provided AS IS for your information and personal use only. It may not be sold, licensed, or shared on other websites without obtaining consent from the author.If you encounter any issues during the download, it is possible that the publisher has removed the file from their server.
You are allowed to download the files provided on this website for personal or commercial use, subject to the condition that they are used lawfully. All files are the property of their respective owners.
The content on the website is provided AS IS for your information and personal use only. It may not be sold, licensed, or shared on other websites without obtaining consent from the author.
E N D
Presentation Transcript
BUSINESS MODEL and DASHBOARD BUSINESS MODEL and DASHBOARD TEMPLATES TEMPLATES
TRADITIONAL 20 TRADITIONAL 20th th CENTURY BUSINESS MODEL CENTURY BUSINESS MODEL BUSINESS Governance Governance Purpose / Vision / Mission / Values / Strategies Human Resources Human Resources People Customers Products & Services Activities & Processes Supplies $ Revenue Financial Assets, Facilities, Financial Assets, Facilities, Equipment, Intellectual Property Equipment, Intellectual Property Lenders & Investors $ Returns
Characteristic 20th Century Capitalism 21st Century Capitalism Purpose of the firm Maximize shareholder wealth Invisible, limitless Environment and Society Short-term profit Financial Profit For direct operational impacts Maximize stakeholderwellbeing, including Environment and Society-at-large Visible Environment-Society-Business nested interdependencies Long-term value creation Natural, Social, Human, Financial Planet, People, Prosperity For direct and indirect impacts across the value chain Business model Strategic focus Capital focus Bottom lines Accountability Negative ESG impacts Externalized; unmanaged Internalized; managed Mandatory financial reporting; optional non- financial / ESG reporting Traditional institutional lenders and investors Fossil fuels Mandatory integrated reporting on financial and non-financial / ESG performance Institutional and private impact investors; crowd-sourcing; co-operatives Low-impact renewable energy Reporting / Disclosure Sources of financial capital Powered by Aggressive tax avoidance (tax havens, etc.) Proudly pay intended right taxes in the right place at the right time Taxes paid
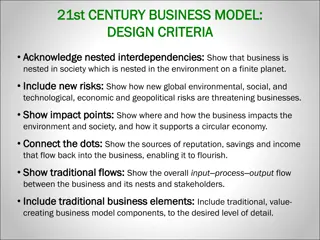
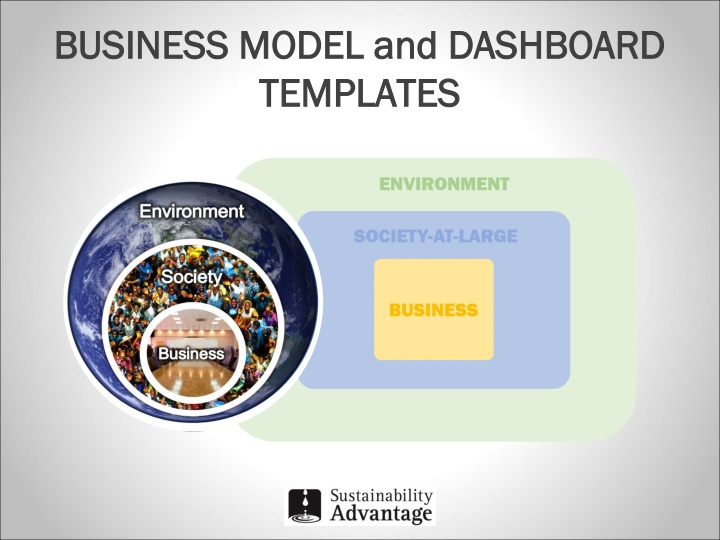
21st CENT 21st CENTUR URY BUSINESS MODEL Y BUSINESS MODEL Design Criteria Design Criteria Acknowledge nested interdependencies: Acknowledge nested interdependencies: Make visible how business is nested in Society, which is nested in the Environment on a finite planet. Show impact points: Show impact points: Make visible where the business impacts stakeholders, to facilitate tracking, managing and reporting on how well the company is fulfilling its maximize stakeholder wellbeing purpose. Include new risks: Include new risks: Make visible how new global environmental, social, technological, economic and geopolitical risks are threatening businesses. Connect the dots: Connect the dots: Make visible the sources of reputation, savings and income that flow back into the business, enabling it to flourish. Show traditional flows: Show traditional flows: Show the overall input process output flow between the business, Environment, Society and other stakeholders. Include traditional business elements: Include traditional business elements: Show traditional, value- creating business model components, to the desired level of detail. The 2st Century Business Model Template satisfies these criteria
21st CENTURY BUSINESS MODEL TEMPLATE 21st CENTURY BUSINESS MODEL TEMPLATE ENVIRONMENT 21st century environmental risks SOCIETY- AT-LARGE BUSINESS Community Impacts Governance Governance Purpose / Vision / Mission / Values / Strategies Reputation Other Social licence $ Other income Stakeholders Human Resources Human Resources People Reputation Customers Reputation $ Revenue Impacts Products & Services Activities & Processes Usage & end-of-life impacts Impacts Supplies Reputation $ Savings Reputation $ Savings Operational impacts Lenders & Investors Financial Assets, Facilities, Financial Assets, Facilities, Equipment, Intellectual Property Equipment, Intellectual Property Reputation $ Savings Reputation & $ Returns
21st CENTURY BUSINESS MODEL TEMPLATE 21st CENTURY BUSINESS MODEL TEMPLATE Capitals Version Capitals Version NATURAL CAPITAL 21st century environmental risks SOCIAL & RELATIONSHIP CAPITAL BUSINESS Community Impacts Governance Governance Purpose / Vision / Mission / Values / Strategies Reputation Other Social licence $ Other income Stakeholders Human Capital Human Capital People Reputation Customers Reputation $ Revenue Impacts Products & Services Activities & Processes Usage & end-of-life impacts Impacts Supplies Reputation $ Savings Reputation $ Savings Operational impacts Lenders & Investors Financial, Manufactured and Financial, Manufactured and Intellectual Capitals Intellectual Capitals Reputation $ Savings Reputation & $ Returns
PERFORMANCE DASHBOARD PERFORMANCE DASHBOARD Design Criteria Design Criteria Use the 21 Use the 21st st century business model as the centerpiece century business model as the centerpiece It shows where the business directly or indirectly impacts stakeholders and frames how well the company is fulfilling its maximize stakeholder wellbeing purpose. Connect scores to stakeholder impact points Connect scores to stakeholder impact points To provide decision-ready performance information, connect stakeholder impact scores to where the business positively and negatively impacts key stakeholders, especially Employees, Customers, Communities, Society-at-large and the Environment. Include financial scores / metrics Include financial scores / metrics To reinforce the potential contribution of social and environmental performance to financial results, as encouraged by integrated reporting, include key financial metrics, such as revenue, expenses, profit, net worth, shareholder returns, etc. The resulting dashboards might look like the following rough sketches. They can be jazzed up with clever graphics, dials, bar charts and colors to help management diagnose areas that warrant attention
PERFORMANCE DASHBOARD PERFORMANCE DASHBOARD Generic Example Generic Example Elimination of harm to employees employees Elimination of harm to society society- -at at- -large, communities communities and customers customers large, + + positive impacts* Key financials financials $___, $___, $___ $___, $___, $___ + + positive impacts* Elimination of harm to the environment environment + + positive impacts* * Companies create positive impacts three ways: 1) create their own positive impacts, 2) help / amplify others positive impacts and 3) help others reduce their negative impacts. All positive impacts are described by the scale, depth, duration and significance of their outcomes.
PERFORMANCE DASHBOARD PERFORMANCE DASHBOARD Future- -Fit Business Benchmark (FFBB) Example Fit Business Benchmark (FFBB) Example Future 75% 75% elimination of harm to employees employees 68% 68% elimination of harm to customers, communities, customers, communities, andsociety society- -at at- -large large Employee health (70%) Living wage (82%) Employment terms (73%) No discrimination (66%) Concerns addressed (85%) Product communications (63%} Product concerns (71%) Products harm (82%) Community health (70%) Business ethics (88%) Right taxes (58%) Lobbying (67%) Financial assets (48%) + + positive pursuits* + + positive pursuits* Key financials financials $___, $___, $___ $___, $___, $___ 62% 62% elimination of harm to the environment obtaining supplies, operations, product usage and end-of-life product disposition environment over products life cycles from Supply impacts Renewable energy (76%) Water (90%) Natural resources (57%) Procurement (30%) Operations impacts Operational emissions (65%) Operations GHGs (72%) Operational waste (40%) Encroachment (87%) Product usage impacts Product GHGs (45%) + + positive pursuits* Product disposition impacts Product repurposing (60%) * Companies undertake positive pursuits three ways: 1) create their own, 2) help / amplify others positive impacts and 3) help others reduce their negative impacts. All positive pursuits are described by the scale, depth, duration and significance of their outcomes.
PERFORMANCE DASHBOARD PERFORMANCE DASHBOARD Sustainable Development Goals (SDGs) Example Sustainable Development Goals (SDGs) Example 75% 75% elimination of negative impacts on employee employee- -related SDGs 68% 68% elimination of negative impacts on community community- - and society at at- -large large- -related SDGs and society- - 82% 85% 68% 68% 72% 70% 68% 68% 61% 82% 68% + + positive contributions* + + positive contributions* Key financials financials $___, $___, $___ $___, $___, $___ 62% 62% elimination of negative impacts on environment obtaining supplies, operations, product usage and EOL product disposition environment-related SDGs from 36% 70% 61% 60% 72% 74% + + positive contributions* * Companies make positive contributions three ways: 1) create their own, 2) help / amplify others positive contributions and 3) help others reduce their negative impacts. All positive contributions are described by the scale, depth, duration and significance of their outcomes.
SUSTAINABILITY DASHBOARD SUSTAINABILITY DASHBOARD Integrated Reporting <IR> Capitals Example Integrated Reporting <IR> Capitals Example 75% 75% elimination of destruction of human capital capital 68% 68% elimination of destruction of social and relationship capital relationship capital human social and SOCIAL AND SOCIAL AND RELATIONSHIP RELATIONSHIP CAPITAL CAPITAL HUMAN HUMAN CAPITAL CAPITAL 75% 68% + creation of human capital* + creation of social and relationship capital* Changes in values of FINANCIAL CAPITAL FINANCIAL CAPITAL MANUFACTURED CAPITAL MANUFACTURED CAPITAL INTELLECTUAL CAPITAL INTELLECTUAL CAPITAL 62% 62% elimination of destruction of natural capital obtaining supplies, operations, product usage and EOL product disposition natural capital over products life cycles from: __% __% __% NATURAL CAPITAL NATURAL CAPITAL 62% + creation of natural capital* * Companies create capital three ways: 1) do it themselves, 2) help / amplify others capital creation efforts and 3) help others reduce their destruction of capital. All capital creation efforts are described by the scale, depth, duration and significance of their outcomes.
PERFORMANCE DASHBOARD PERFORMANCE DASHBOARD B Corp Business Impact Assessment (BIA) Example B Corp Business Impact Assessment (BIA) Example Score on worker BIA Qs worker-related Score on customer customer- --and community community-related BIA Qs + + Score on associated Impact Business Model BIA Qs* + + Scores on associated Impact Business Model BIA Qs* Key financials financials $___, $___, $___ $___, $___, $___ Score on environment environment- -related BIAs about impacts from: obtaining supplies, operations, product usage and end-of-life product disposition + + Score on associated Impact Business Model BIA Qs* * Impact Business Models are described by the scale, depth, duration and significance of their outcomes.