Estimation and Confidence Intervals

Estimation and Confidence
Intervals
Learning Objectives
Know the difference between point and interval estimation.
Estimate a population mean from a sample mean when
is known.
Estimate a population mean from a sample mean when
is unknown.
Estimate a population proportion from a sample proportion.
Estimate the population variance from a sample variance.
Estimate the minimum sample size necessary to achieve given statistical goals.
Statistical Estimation
Point estimate -- the single value of a statistic calculated from a
sample.
A
point estimate
is the statistic, computed from sample information,
which is used to estimate the population parameter.
Statistical Estimation
A
confidence interval estimate
is a range of values constructed from
sample data so that the population parameter is likely to occur within
that range at a specified probability. The specified probability is called
the level of confidence.
Interval Estimate - a range of values calculated from a sample statistic(s) and
standardized statistics, such as the
z
.
Selection of the standardized statistic is determined
by the sampling distribution.
Selection of critical values of the standardized statistic
is determined by the desired level of confidence.
F
a
c
t
o
r
s
A
f
f
e
c
t
i
n
g
C
o
n
f
i
d
e
n
c
e
I
n
t
e
r
v
a
l
E
s
t
i
m
a
t
e
s
The factors that determine the width of a confidence
interval are:
1.The
sample size
,
n.
2.The
variability in the population
, usually
σ
estimated by
s.
3.The desired
level of confidence
.
Point and Interval Estimates
A
point estimate
is a single number,
a
confidence interval
provides additional information about
variability
P
o
i
n
t
E
s
t
i
m
a
t
e
L
o
w
e
r
C
o
n
f
i
d
e
n
c
e
L
i
m
i
t
U
p
p
e
r
C
o
n
f
i
d
e
n
c
e
L
i
m
i
t
W
i
d
t
h
o
f
c
o
n
f
i
d
e
n
c
e
i
n
t
e
r
v
a
l
Confidence Intervals
How much uncertainty is associated with a point estimate of a
population parameter?
An
interval estimate
provides more information about a
population characteristic than does a
point estimate
Such interval estimates are called
confidence intervals
Interval Estimates
-
Interpretation
For a 95% confidence interval about 95% of the similarly constructed intervals
will contain the parameter being estimated. Also 95% of the sample means for a
specified sample size will lie within 1.96 standard deviations of the hypothesized
population
Estimation Process
(
m
e
a
n
,
μ
,
i
s
u
n
k
n
o
w
n
)
Population
Random Sample
M
e
a
n
X
=
5
0
S
a
m
p
l
e
Confidence Interval to Estimate
when
is Known
Point estimate
Interval Estimate
95% Confidence Interval for
95% Confidence Interval for
Question:
A survey was taken of U.S. companies that do business with firms in India.
One of the questions on the survey was: Approximately how many years ha
your company been trading with firms in India? A random sample of 44
responses to this question yielded a mean of 10.455 years. Suppose the
population standard deviation for this question is 7.7 years. Using this
information , construct a 90%condidence interval for the mean number of
years that a company has been trading in India for the population of U.S.
companies trading with firms in India.
Solution:
The analyst is 90% confident that is a census of al U.S. companies trading
with firms in India were taken at the time of this survey, the actual population
mean number of years a company would have been trading with firms in India
would be between 8.545 and 12.365. The point estimate is 10.455 years
Question:
A study is conducted I a company that employs 800
engineers. A random sample of 50 engineers reveals that
the average sample age is 34.3 years. Historically, the
population standard deviation of the age of the company’s
engineers is approximately 8 years. Construct a 98%
confidence interval to estimate the average age of all the
engineers in this company.
Solution:
The finite correction factor takes into account the fact that the population is only
800 instead of being infinitely large. The sample,
n
= 50, is a greater proportion
of the 800 than it would be of a larger population, and thus the width of the
confidence interval is reduced.
Confidence Interval to Estimate
when
n
is Large and
is Known
Question:
Suppose a U.S. car rental firm wants to estimate the
average number of miles traveled per day by each of
its car rented in California. A random sample of 110
cars rented in California reveals that the sample mean
travel distance per day is 85.5miles, with a sample
standard deviation of 19.3miles. Compute a 99%
confidence Interval to estimate
µ
Solution:
Z Values for Some of the More
Common Levels of Confidence
Estimating the Mean of a Normal
Population:
Unknown
The population has a normal distribution.
The value of the population standard deviation is unknown.
z distribution is not appropriate for these conditions
t
distribution is appropriate
The
t
Distribution
Developed by British statistician,
William Gosset
A family of distributions - a unique distribution for each value of its
parameter, degrees of freedom (d.f.)
Symmetric, Unimodal, Mean = 0, Flatter than a
z
t
formula
Confidence Intervals for
of a
Normal Population: Unknown
Example
A tire manufacturer wishes to investigate the tread life of its
tires. A sample of 10 tires driven 50,000 miles revealed a
sample mean of 0.32 inch of tread remaining with a
standard deviation of 0.09 inch. Construct a 95 percent
confidence interval for the population mean. Would it be
reasonable for the manufacturer to conclude that after
50,000 miles the population mean amount of tread
remaining is 0.30 inches?
Confidence Interval for the Mean
Example using the t-distribution
Student
’
s t-distribution Table
Question:
The owner of a large equipment rental company wants to make a rather
quick estimate of the average number of days a piece of ditch-digging
equipment is rented out per person per time. The company has record of all
accounts world be prohibitive. The owner decides to take a random sample
of rental invoices. Fourteen different rentals of ditch-diggers are selected
randomly from the files, yielding the following data. She uses these data to
construct a 99% confidence interval to estimate the average number of days
that a ditch-digger is rented and assumes that the number of days per rental
is normally distributed in the population.
3 1 3 2 5 1 2 1 4 2 1 3 1 1
Solution:
Solution:
Example:
There are 250 families in Scandia, Pennsylvania. A random sample of 40 of
these families revealed the mean annual church contribution was $450 and
the standard deviation of this was $75.
Develop a 90 percent confidence interval for the population mean.
Interpret the confidence interval.
Solution:
Given in Problem:
N – 250
n – 40
s - $75
Since n/N = 40/250 = 0.16, the finite population correction factor must be used.
The population standard deviation is not known therefore use the t-distribution (may
use the z-dist since n>30)
Use the formula below to compute the confidence interval:
Confidence Interval to Estimate
the Population Proportion
Problem:
A
c
l
o
t
h
i
n
g
c
o
m
p
a
n
y
p
r
o
d
u
c
e
s
m
e
n
’
s
j
e
a
n
s
.
T
h
e
j
e
a
n
s
a
r
e
m
a
d
e
a
n
d
s
o
l
d
w
i
t
h
e
i
t
h
e
r
a
r
e
g
u
l
a
r
c
u
t
o
r
a
b
o
o
t
c
u
t
.
I
n
a
n
e
f
f
o
r
t
t
o
e
s
t
i
m
a
t
e
t
h
e
p
r
o
p
o
r
t
i
o
n
o
f
t
h
e
i
r
m
e
n
’
s
j
e
a
n
s
m
a
r
k
e
t
i
n
O
k
l
a
h
o
m
a
C
i
t
y
t
h
a
t
p
r
e
f
e
r
s
b
o
o
t
-
c
u
t
j
e
a
n
s
,
t
h
e
a
n
a
l
y
s
t
t
a
k
e
s
a
r
a
n
d
o
m
s
a
m
p
l
e
o
f
2
1
2
j
e
a
n
s
s
a
l
e
s
f
o
r
m
t
h
e
c
o
m
p
a
n
y
’
s
t
w
o
O
k
l
a
h
o
m
a
C
i
t
y
r
e
t
a
i
l
o
u
t
l
e
t
s
.
O
n
l
y
3
4
o
f
t
h
e
s
a
l
e
s
w
e
r
e
f
o
r
b
o
o
t
-
c
u
t
j
e
a
n
s
.
C
o
n
s
t
r
u
c
t
a
9
0
%
c
o
n
f
i
d
e
n
c
e
i
n
t
e
r
v
a
l
t
o
e
s
t
i
m
a
t
e
t
h
e
p
r
o
p
o
r
t
i
o
n
o
f
t
h
e
p
o
p
u
l
a
t
i
o
n
i
n
O
k
l
a
h
o
m
a
C
i
t
y
w
h
o
p
r
e
f
e
r
b
o
o
t
-
c
u
t
j
e
a
n
s
.
Solution:
Population Variance
Variance is an inverse measure of the group’s homogeneity.
Variance is an important indicator of total quality in standardized products and
services. Managers improve processes to reduce variance.
Variance is a measure of financial risk. Variance of rates of return help managers
assess financial and capital investment alternatives.
Variability is a reality in global markets. Productivity, wages, and costs of living vary
between regions and nations.
Estimating the Population
Variance
Population Parameter
Estimator of
formula for Single Variance
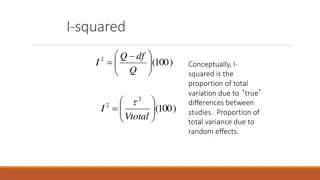
Confidence Interval for
2
90% Confidence Interval for
2
Problem:
The U.S. Bureau of Labor Statistics publishes data on the hourly
compensation costs for production workers in manufacturing for various
countries. The latest figures published for Greece show that the average
hourly wage for a production worker in manufacturing in $9.63. Suppose
the business council of Greece wants to know how consistent this figure is.
They randomly select 25 production workers in manufacturing from across
the country and determine that the standard deviation of hourly wages for
such workers is $1.12. Use this information to develop a 95% confidence
interval to estimate the population variance for the hurly wages of
production workers in manufacturing in Greece. Assume that the hourly
wages for production workers across the country in manufacturing are
normally distributed.
Solution:
Problem:
T
h
e
I
n
t
e
r
s
t
a
t
e
C
o
n
f
e
r
e
n
c
e
o
f
E
m
p
l
o
y
m
e
n
t
S
e
c
u
r
i
t
y
A
g
e
n
c
i
e
s
s
a
y
s
t
h
e
a
v
e
r
a
g
e
w
o
r
k
w
e
e
k
i
n
t
h
e
U
n
i
t
e
d
S
a
t
e
s
i
s
d
o
w
n
t
o
o
n
l
y
3
5
h
o
u
r
s
,
l
a
r
g
e
l
y
b
e
c
a
u
s
e
o
f
a
r
i
s
e
i
n
p
a
r
t
-
t
i
m
e
w
o
r
k
e
r
s
.
S
u
p
p
o
s
e
t
h
i
s
f
i
g
u
r
e
w
a
s
o
b
t
a
i
n
e
d
f
o
r
m
a
a
r
a
n
d
o
m
s
a
m
p
l
e
o
f
2
0
w
o
r
k
e
r
s
a
n
d
t
h
a
t
t
h
e
s
t
a
n
d
a
r
d
d
e
v
i
a
t
i
o
n
o
f
t
h
e
s
a
m
p
l
e
w
a
s
4
.
3
h
o
u
r
s
.
A
s
s
u
m
e
h
o
u
r
s
w
o
r
k
e
d
p
e
r
w
e
e
k
a
r
e
n
o
r
m
a
l
l
y
d
i
s
t
r
i
b
u
t
e
d
i
n
t
h
e
p
o
p
u
l
a
t
i
o
n
.
U
s
e
t
h
i
s
s
a
m
p
l
e
i
n
f
o
r
m
a
t
i
o
n
t
o
d
e
v
e
l
o
p
a
9
8
%
c
o
n
f
i
d
e
n
c
e
i
n
t
e
r
v
a
l
f
o
r
t
h
e
p
o
p
u
l
a
t
i
o
n
v
a
r
i
a
n
c
e
o
f
t
h
e
n
u
m
b
e
r
o
f
h
o
u
r
s
w
o
r
k
e
d
p
e
r
w
e
e
k
f
o
r
a
w
o
r
k
e
r
.
Solution:
n
= 20
s
= 4.3
s
2
= 18.49
98% C.I. df = 20 – 1 = 19
2
.99,19 = 7.63273
2
.01,19 = 36.1980
<
2
<
9
.
7
1
<
2
<
4
6
.
0
3
Determining Sample Size when
Estimating
z formula
Error of Estimation (tolerable error)
Estimated Sample Size
Estimated
Problem:
S
u
p
p
o
s
e
a
r
e
s
e
a
r
c
h
e
r
w
a
n
t
s
t
o
e
s
t
i
m
a
t
e
t
h
e
a
v
e
r
a
g
e
m
o
n
t
h
l
y
e
x
p
e
n
d
i
t
u
r
e
o
n
t
h
e
b
r
e
a
d
b
y
a
f
a
m
i
l
y
i
n
C
h
i
c
a
g
o
.
S
h
e
w
a
n
t
s
t
o
b
e
9
0
%
c
o
n
f
i
d
a
n
t
o
f
h
e
r
r
e
s
u
l
t
s
.
H
o
w
m
u
c
h
e
r
r
o
r
i
s
s
h
e
w
i
l
l
i
n
g
t
o
t
o
l
e
r
a
t
e
i
n
t
h
e
r
e
s
u
l
t
s
?
S
u
p
p
o
s
e
s
h
e
w
a
n
t
s
t
h
e
e
s
t
i
m
a
t
e
w
i
t
h
i
n
$
1
.
0
0
o
f
t
h
e
a
c
t
u
a
l
f
i
g
u
r
e
a
n
d
t
h
e
s
t
a
n
d
a
r
d
d
e
v
i
a
t
i
o
n
o
f
a
v
e
r
a
g
e
m
o
n
t
h
l
y
b
r
e
a
d
p
u
r
c
h
a
s
e
s
i
s
$
4
.
0
0
.
w
h
a
t
i
s
t
h
e
s
a
m
p
l
e
s
i
z
e
e
s
t
i
m
a
t
i
o
n
f
o
r
t
h
i
s
p
r
o
b
l
e
m
?
Sample Size When Estimating
µ
: Example
Question:
S
u
p
p
o
s
e
y
o
u
w
a
n
t
t
o
e
s
t
i
m
a
t
e
t
h
e
a
v
e
r
a
g
e
a
g
e
o
f
a
l
l
B
o
e
i
n
g
7
2
7
a
i
r
p
l
a
n
e
s
n
o
w
i
n
a
c
t
i
v
e
d
o
m
e
s
t
i
c
U
.
S
.
s
e
r
v
i
c
e
.
Y
o
u
w
a
n
t
t
o
b
e
9
5
%
c
o
n
f
i
d
e
n
t
,
a
n
d
y
o
u
w
a
n
t
y
o
u
r
e
s
t
i
m
a
t
e
t
o
b
e
w
i
t
h
i
n
t
w
o
y
e
a
r
s
o
f
t
h
e
a
c
t
u
a
l
f
i
g
u
r
e
.
T
h
e
7
2
7
w
a
s
f
i
r
s
t
p
l
a
c
e
d
i
n
s
e
r
v
i
c
e
a
b
o
u
t
3
0
y
e
a
r
s
a
g
o
,
b
u
t
y
o
u
b
e
l
i
e
v
e
t
h
a
t
n
o
a
c
t
i
v
e
7
2
7
s
i
n
t
h
e
U
.
S
.
d
o
m
e
s
t
i
c
f
l
e
e
t
a
r
e
m
o
r
e
t
h
a
n
2
5
y
e
a
r
s
o
l
d
.
H
o
w
l
a
r
g
e
a
s
a
m
p
l
e
s
h
o
u
l
d
y
o
u
t
a
k
e
?
Solution:
Determining Sample Size when Estimating
p
z formula
Error of Estimation (tolerable error)
Estimated Sample Size
Question
:
Hewitt Associates conducted a national survey to determine the extent to
which employers are promoting health and fitness among their employees.
One of the questions asked was, Does your company offer on-site exercise
classes? Suppose it was estimated before the study that no more than 40%
of the companies would answer Yes. How large a sample would Hewitt
Associates have to take in estimating the population proportion to ensure a
98% confidence in the results and to be within .03 of the true population
proportion?
Solution:
D
e
t
e
r
m
i
n
i
n
g
S
a
m
p
l
e
S
i
z
e
w
h
e
n
E
s
t
i
m
a
t
i
n
g
p
w
i
t
h
N
o
P
r
i
o
r
I
n
f
o
r
m
a
t
i
o
n
Example:
Determining n when
Estimating
p
with No Prior Information
Learn the difference between point and interval estimation, estimate population parameters, factors affecting confidence intervals, interpretation of interval estimates, and more in statistical estimation and confidence intervals.

Download Presentation

Please find below an Image/Link to download the presentation.
The content on the website is provided AS IS for your information and personal use only. It may not be sold, licensed, or shared on other websites without obtaining consent from the author.If you encounter any issues during the download, it is possible that the publisher has removed the file from their server.
You are allowed to download the files provided on this website for personal or commercial use, subject to the condition that they are used lawfully. All files are the property of their respective owners.
The content on the website is provided AS IS for your information and personal use only. It may not be sold, licensed, or shared on other websites without obtaining consent from the author.
E N D
Presentation Transcript
Estimation and Confidence Intervals
Learning Objectives Know the difference between point and interval estimation. Estimate a population mean from a sample mean when is known. Estimate a population mean from a sample mean when is unknown. Estimate a population proportion from a sample proportion. Estimate the population variance from a sample variance. Estimate the minimum sample size necessary to achieve given statistical goals.
Statistical Estimation Point estimate -- the single value of a statistic calculated from a sample. A point estimate is the statistic, computed from sample information, which is used to estimate the population parameter.
Statistical Estimation A confidence interval estimate is a range of values constructed from sample data so that the population parameter is likely to occur within that range at a specified probability. The specified probability is called the level of confidence. Interval Estimate - a range of values calculated from a sample statistic(s) and standardized statistics, such as the z. Selection of the standardized statistic is determined by the sampling distribution. Selection of critical values of the standardized statistic is determined by the desired level of confidence.
Factors Affecting Confidence Interval Estimates The factors that determine the width of a confidence interval are: 1.The sample size, n. 2.The variability in the population, usually estimated by s. 3.The desired level of confidence.
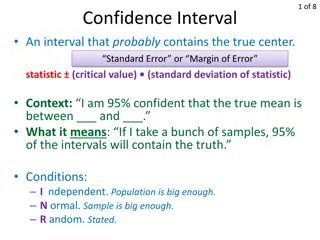
Point and Interval Estimates A point estimate is a single number, a confidence interval provides additional information about variability Upper Confidence Limit Lower Confidence Limit Point Estimate Width of confidence interval
Confidence Intervals How much uncertainty is associated with a point estimate of a population parameter? An interval estimate provides more information about a population characteristic than does a point estimate Such interval estimates are called confidence intervals
Interval Estimates - Interpretation For a 95% confidence interval about 95% of the similarly constructed intervals will contain the parameter being estimated. Also 95% of the sample means for a specified sample size will lie within 1.96 standard deviations of the hypothesized population
Estimation Process I am 95% confident that is between 40 & 60. Random Sample Population Mean X = 50 (mean, , is unknown) Sample
Confidence Interval to Estimate when is Known x = x Point estimate n x z n Interval Estimate or + x z x z n n
95% Confidence Interval for = , 1 . 1 = = . 4 26 , 60 . x and n + x z x z n n 1 . 1 1 . 1 . 1 . 1 + . 4 26 96 . 4 26 96 60 60 + . 4 26 . 0 25 . 4 26 . 0 25 . 4 01 . 4 51
95% Confidence Interval for = = = 153 , 46 , 85 . x and n + x z x z n n 46 46 . 1 . 1 + 153 96 153 96 85 85 + 153 . 9 78 153 . 9 78 143 22 . 162 78 .
Question: A survey was taken of U.S. companies that do business with firms in India. One of the questions on the survey was: Approximately how many years ha your company been trading with firms in India? A random sample of 44 responses to this question yielded a mean of 10.455 years. Suppose the population standard deviation for this question is 7.7 years. Using this information , construct a 90%condidence interval for the mean number of years that a company has been trading in India for the population of U.S. companies trading with firms in India.
Solution: = = = 10 455 . , , 7 . 7 44 . x n . 1 = confidence % 90 645 z + x z x z n n 7 . 7 7 . 7 . 1 . 1 + 10 . 455 645 10 455 . 645 44 44 . 1 . 1 + 10 455 . 91 10 455 . 91 . 8 545 12 365 . The analyst is 90% confident that is a census of al U.S. companies trading with firms in India were taken at the time of this survey, the actual population mean number of years a company would have been trading with firms in India would be between 8.545 and 12.365. The point estimate is 10.455 years
Question: A study is conducted I a company that employs 800 engineers. A random sample of 50 engineers reveals that the average sample age is 34.3 years. Historically, the population standard deviation of the age of the company s engineers is approximately 8 years. Construct a 98% confidence interval to estimate the average age of all the engineers in this company.
Solution: = , 8 = = 34 , 3 . = 800 = z and , 50 . x N n confidence % 98 . 2 33 N n N n + x z x z 1 1 N N n n 8 800 50 8 800 50 + 34 3 . . 2 33 34 3 . . 2 33 800 1 800 1 50 50 + 34 3 . . 2 554 34 3 . . 2 554 31 75 . 36 85 . The finite correction factor takes into account the fact that the population is only 800 instead of being infinitely large. The sample, n = 50, is a greater proportion of the 800 than it would be of a larger population, and thus the width of the confidence interval is reduced.
Confidence Interval to Estimate when n is Large and is Known x z 2 n or + x z x z 2 2 n n
Question: Suppose a U.S. car rental firm wants to estimate the average number of miles traveled per day by each of its car rented in California. A random sample of 110 cars rented in California reveals that the sample mean travel distance per day is 85.5miles, with a sample standard deviation of 19.3miles. Compute a 99% confidence Interval to estimate
Solution: = = = S , 5 . 85 19 , 3 . and = 110 . x n confidence % 99 . 2 575 z + x z x z n n 19 3 . 19 3 . + 85 5 . . 2 575 85 5 . . 2 575 110 110 7 . 4 7 . 4 + 85 5 . 85 5 . 80 8 . 90 2 .
Z Values for Some of the More Common Levels of Confidence Confidence Level z Value 90% 1.645 95% 1.96 98% 2.33 99% 2.575
Estimating the Mean of a Normal Population: Unknown The population has a normal distribution. The value of the population standard deviation is unknown. z distribution is not appropriate for these conditions t distribution is appropriate
The t Distribution Developed by British statistician, William Gosset A family of distributions - a unique distribution for each value of its parameter, degrees of freedom (d.f.) Symmetric, Unimodal, Mean = 0, Flatter than a z t formula x = t s n
Confidence Intervals for of a Normal Population: Unknown s x t n or s s + x t x t n n = 1 df n
Example A tire manufacturer wishes to investigate the tread life of its tires. A sample of 10 tires driven 50,000 miles revealed a sample mean of 0.32 inch of tread remaining with a standard deviation of 0.09 inch. Construct a 95 percent confidence interval for the population mean. Would it be reasonable for the manufacturer to conclude that after 50,000 miles the population mean amount of tread remaining is 0.30 inches?
Confidence Interval for the Mean Example using the t-distribution Given = in the problem : 10 n = . 0 32 x = . 0 09 s Compute the C.I. using the unknown) is - t dist. (since s X t n 1 , 2 / n
Question: The owner of a large equipment rental company wants to make a rather quick estimate of the average number of days a piece of ditch-digging equipment is rented out per person per time. The company has record of all accounts world be prohibitive. The owner decides to take a random sample of rental invoices. Fourteen different rentals of ditch-diggers are selected randomly from the files, yielding the following data. She uses these data to construct a 99% confidence interval to estimate the average number of days that a ditch-digger is rented and assumes that the number of days per rental is normally distributed in the population. 3 1 3 2 5 1 2 1 4 2 1 3 1 1
Solution: = . 1 = = = = . 2 14 , 29 , 14 , 1 13 x s n df n 1 . 99 = = . 0 005 2 t 2 = . 3 012 . 005 13 ,
Solution: s s + x t x t n n . 1 29 . 1 29 + . 2 14 . 3 012 . 2 14 . 3 012 14 14 . 1 . 1 + . 2 14 04 . 2 14 04 . 1 10 . 3 18
Example: There are 250 families in Scandia, Pennsylvania. A random sample of 40 of these families revealed the mean annual church contribution was $450 and the standard deviation of this was $75. Develop a 90 percent confidence interval for the population mean. Interpret the confidence interval.
Solution: Given in Problem: N 250 n 40 s - $75 Since n/N = 40/250 = 0.16, the finite population correction factor must be used. The population standard deviation is not known therefore use the t-distribution (may use the z-dist since n>30) Use the formula below to compute the confidence interval: s N n X t 1 N n
s N n X t 1 N n $ 75 250 40 = $ 450 10 . t , 40 1 250 1 40 75 $ 250 40 = . 1 $ 450 685 250 1 40 = $ 450 $ 19 . 98 . 8434 = $ 450 $ 18 . 35 = ($ 431 . 65 ,$ 468 . 35 ) likely tha is It population t the mean more is than $431.65 but less than $468.35. population the could y, another wa it put To mean $445? be Yes, but it is not within th is $445 value the because $425 is it t likely tha confidence e not within is $425 and interval confidence the interval.
Confidence Interval to Estimate the Population Proportion n q n q p p + p p z p z 2 2 : where sample = p proportion q p = 1 - population = p proportion sample = n size
Problem: A clothing company produces men s jeans. The jeans are made and sold with either a regular cut or a boot cut. In an effort to estimate the proportion of their men s jeans market in Oklahoma City that prefers boot-cut jeans, the analyst takes a random sample of 212 jeans sales form the company s two Oklahoma City retail outlets. Only 34 of the sales were for boot- cut jeans. Construct a 90% confidence interval to estimate the proportion of the population in Oklahoma City who prefer boot- cut jeans.
Solution: 34 x = = = = = , 212 , 34 . 0 16 n x p 212 n = = q p = 1 - Confidence 1 . 0 16 . 0 z 84 . 1 = 90 % 645 n q n q p p + p p z p z . 0 ( 16 . 0 )( 84 ) . 0 ( 16 . 0 )( 84 ) . 1 . 1 + . 0 16 645 . 0 16 645 p 212 212 + . 0 16 . 0 04 . 0 16 . 0 04 p . 0 12 . 0 20 p
Population Variance Variance is an inverse measure of the group s homogeneity. Variance is an important indicator of total quality in standardized products and services. Managers improve processes to reduce variance. Variance is a measure of financial risk. Variance of rates of return help managers assess financial and capital investment alternatives. Variability is a reality in global markets. Productivity, wages, and costs of living vary between regions and nations.
Estimating the Population Variance Population Parameter Estimator of 2 ( ) x x = 2 s 1 n 2 ( ) 1 2 n s formula for Single Variance = 2 = degrees of freedom 1 - n
Confidence Interval for 2 ( ) ( ) 2 2 1 1 2 n s n s 2 2 1 2 n 2 = 1 df = level 1 of confidence
90% Confidence Interval for 2 = = = = = 2 . 0022125 , , 8 = 1 , 7 . 10 s n df n = = 2 2 2 05 . 14 . 0671 1 . 2 2 = = = 2 2 2 95 . . 2 16735 1 . 1 1 2 2 __________ __________ s n __________ ________ 2 2 ( ) 1 2 ( ) 1 2 n s 2 1 2 2 8 ( 0022125 ). 1 8 ( 0022125 ). 1 2 14 . 0671 . 2 16735 2 . 001101 . 007146
Problem: The U.S. Bureau of Labor Statistics publishes data on the hourly compensation costs for production workers in manufacturing for various countries. The latest figures published for Greece show that the average hourly wage for a production worker in manufacturing in $9.63. Suppose the business council of Greece wants to know how consistent this figure is. They randomly select 25 production workers in manufacturing from across the country and determine that the standard deviation of hourly wages for such workers is $1.12. Use this information to develop a 95% confidence interval to estimate the population variance for the hurly wages of production workers in manufacturing in Greece. Assume that the hourly wages for production workers across the country in manufacturing are normally distributed.
Solution: 2544 . 1 = = = = = 2 , 25 , 1 24 , 05 . s n df n 2 2 . 2 = = = 3641 . 39 05 . 025 2 2 2 2 2 = = = 12 . 4011 05 . 1 1 . 975 2 2 ( ) ( ) 2 2 1 1 2 n s n s 2 2 1 2 2 ( ) . ( ) 4011 . 25 1 . 1 ( 2544 ) 25 1 . 1 ( 2544 ) 2 39 3641 12 2 . 0 7648 . 2 4277
Problem: The Interstate Conference of Employment Security Agencies says the average workweek in the United Sates is down to only 35 hours, largely because of a rise in part-time workers. Suppose this figure was obtained forma a random sample of 20 workers and that the standard deviation of the sample was 4.3 hours. Assume hours worked per week are normally distributed in the population. Use this sample information to develop a 98%confidence interval for the population variance of the number of hours worked per week for a worker.
Solution: n = 20 s = 4.3 s2 = 18.49 98% C.I. df = 20 1 = 19 2.99,19 = 7.63273 2.01,19 = 36.1980 ( 20 1 )( 18 49 . ) < 2 < ) 49 . 18 )( 1 ( 20 63273 . 7 1980 . 36 9.71 < 2 < 46.03
Determining Sample Size when Estimating x = z z formula n = x E Error of Estimation (tolerable error) 2 2 2 2 z z 2 Estimated Sample Size = = n 2 E E 1 4range Estimated
Problem: Suppose a researcher wants to estimate the average monthly expenditure on the bread by a family in Chicago. She wants to be 90% confidant of her results. How much error is she willing to tolerate in the results? Suppose she wants the estimate within $1.00 of the actual figure and the standard deviation of average monthly bread purchases is $4.00. what is the sample size estimation for this problem?
Sample Size When Estimating : Example , 1 = = 4 E . 1 = 90 confidence % 645 z 2 2 z = 2 E n 2 2 2 . 1 ( 645 ) ) 4 ( = 12 = 43 . 30 or 44
Question: Suppose you want to estimate the average age of all Boeing 727 airplanes now in active domestic U.S. service. You want to be 95% confident, and you want your estimate to be within two years of the actual figure. The 727 was first placed in service about 30 years ago, but you believe that no active 727s in the U.S. domestic fleet are more than 25 years old. How large a sample should you take?
Solution: = = , 2 25 E range . 1 = confidence % 95 96 z 1 1 ( ) 25 = = . 6 25 estimated range 4 4 2 2 z = n 2 E 2 2 . 1 ( 96 ) . 6 ( 25 ) = 22 = 37 52 . or 38
Determining Sample Size when Estimating p z formula p p = Z p q n Error of Estimation (tolerable error) = E p p Estimated Sample Size 2 z pq 2 = n E
Question: Hewitt Associates conducted a national survey to determine the extent to which employers are promoting health and fitness among their employees. One of the questions asked was, Does your company offer on-site exercise classes? Suppose it was estimated before the study that no more than 40% of the companies would answer Yes. How large a sample would Hewitt Associates have to take in estimating the population proportion to ensure a 98% confidence in the results and to be within .03 of the true population proportion?