Estimating Standard Error Using Bootstrap Method
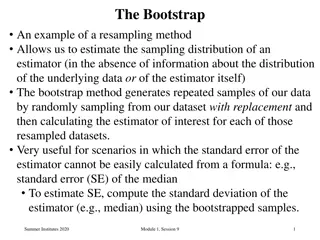
The bootstrap method is a computer-based technique for estimating the standard error of a parameter regardless of its mathematical complexity. It involves creating multiple samples by resampling from the original data and can be used for various statistical analyses including curve fitting, eigenvalue estimation, and more. This method is particularly useful when the distribution of the parameter of interest is unknown.

Download Presentation

Please find below an Image/Link to download the presentation.
The content on the website is provided AS IS for your information and personal use only. It may not be sold, licensed, or shared on other websites without obtaining consent from the author.If you encounter any issues during the download, it is possible that the publisher has removed the file from their server.
You are allowed to download the files provided on this website for personal or commercial use, subject to the condition that they are used lawfully. All files are the property of their respective owners.
The content on the website is provided AS IS for your information and personal use only. It may not be sold, licensed, or shared on other websites without obtaining consent from the author.
E N D
Presentation Transcript
Statistics M.Sc seminar Estimating standard error using bootstrap Matan Schlesinger
Table of contents The bootstrap estimator of standard error- chapter 6 Estimating the standard error The number of bootstrap replications Parametric bootstrap and textbook formulas Bootstrap standard error examples chapter 7 Eigenvalues Curve fitting Example of bootstrap sampling failure 2
The bootstrap estimator of standard error chapter 6 3
The problem Suppose that we have a random sample ? = (?1, ?2, , ??) from an unknown distribution and we wish to estimate some parameter of interest ? = ?(?). For this purpose, we calculate an estimate ? = ? ? Now, we want to ask how accurate is ? ? The bootstrap is computer based method for estimating the standard error of ?, regardless of how mathematically complicated ? is. 4
Non parametric Bootstrap- sample and estimate 1 ?on each of the observed Let ? be the empirical distribution, putting probability values ??, ? = 1,2, ,?. A bootstrap sample is defined to be a random sample of size n drawn from ?, ? ,?2 ,?? ) = (?1 Corresponding to ? we have a replication of ?, ? = ?(? ) (for example if ? ? is ?? ? the sample mean ?, then ? ? = ? = ?=1 ? The bootstrap plugin estimate of ??? ? is ?? ? ? - a plugin estimate that uses ? instead of ? 6
Parametric bootstrap - sample and estimate Now, Let ? be a distribution from some parametric model, where the parameters of ? are estimated from our sample (?) Now we sample a random sample in the size of n drawn from ?, ? = (?1 ,?2 ,?? ) Corresponding to ? we have a replication of ?, ? = ?(? ) (for example if ? ? is ?? ? the sample mean ?, then ? ? = ? = ?=1 ? The bootstrap plugin estimate of ??? ? is ?? ? ? - a plugin estimate that uses ? instead of ? 7
The bootstrap algorithm for estimating standard errors Select B independent bootstrap samples ? 1,? 2, ,? ?, each consisting of n data values drawn from ? Evaluate the bootstrap replication for each bootstrap sample ? b = s(? ?) ? = 1 ? Estimate the standard error ??? ? by the sample standard deviation of the B 2 ? ? ? replications: ? ?=1 ???= /(? 1) ? ? (?) ? ?=1 where: ? = 8
What happens when ? Question: does the bootstrap estimator for the standard error equals the standard ???( ? ) = ??? ? ? error when ? ? lim ? 10
What happens when ? Question: does the bootstrap estimator for the standard error equals the standard ???( ? ) = ??? ? ? NO error when ? ? lim ? ???( ? ) = ?? ? ? lim ? ?? ? ? is the ideal bootstrap estimator (the plugin estimate) 11
The number of bootstrap replications B Depends mainly on how much long it takes to evaluate the bootstrap replications, for any ?(?) increases linearly in B. ???( ? ) to ?? ( ? ) = ?? ? ? and to ??? ? We would like to know how close is For nonparametric bootstrap, n approximate, can be phrased in terms of the ???( ? ) coefficient of variation of 12
Coefficient of variation Coefficient of variation of a random variable X [?~(??,?2?] is defined to be the ratio of its standard deviation to the absolute value of it s mean: ?? ?? ???? = In other words, ???measures the randomness in X relative to it s size. ??( ?? ???) ??? For our needs, ??? ??? = 13
How much does B affect the coefficient of variation An approximation for ?? ??? is: 1/2 ?? )2+? + 2 ?? ??? = ??( - stands for kurtosis 4? ? 25 50 100 200 ?? ?? 0.29 0.27 0.26 0.25 0.25 0.25 0.24 0.22 0.21 0.21 0.20 0.20 0.21 0.18 0.17 0.16 0.15 0.15 0.17 0.14 0.12 0.11 0.10 0.10 0.15 0.11 0.09 0.07 0.05 0.05 0.14 0.10 0.07 0.05 0.00 0.00 table assumes = 0 14
A more robust way to estimate the standard deviation A biased but more robust estimate of the bootstrap standard error is: ?(?) ?(1 ?) 2?(?) ???,?= Where ?(?) is 100?? quantile of the bootstrap replications and ?(?)is the 100?? percentile of the standard normal distribution 15
Parametric bootstrap in compare to textbook formulas It might seem strange to use bootstrap to estimate standard error when textbook formula can be used In fact bootstrap can be carried out parametrically and give results which are closely related to textbook formulas Most textbook formulas for standard errors are approximations based on normal theory, and will typically gives answers close to the parametric bootstrap that draws samples from a normal distribution 17
Example- empirical correlation - comparison between textbook formula and parametric (normal) bootstrap ?~? 60,100 ? = ? + ? ?~? 20,20 ? = ??? ?,? 0.707 It has been shown that for the empirical correlation ?, 1+ ? 1 ? 1+? 1 ?, 1 ? = 0.5 log ~? 0.5 log ? 3 1 97= 1.1015 So for n=100, we get ?? ? ??3000 ? = 0.102 18
Bootstrap advantages in compare to textbook formulas When used in nonparametric mode, it relieves us from having to make parametric assumptions about the form of population distribution When used in parametric mode, sometimes it provides more accurate answers than textbook formulas, and can provide answers in problems for which no textbook formulae exist. 19
Bootstrap standard error - some examples- chapter 7 20
Eigenvalues 21
Example- test scores data Suppose that we have a data for test score of 88 students, each of them took 5 students For this data we have a 88x5 data matrix X, where the ?? row of the of the data is ??= (??1,??2,??3,??4,??5) From this matrix we can create an empirical covariance matrix G (size 5x5) where 1 88 ?=1 88 ???= ??? ?? ??? ?? ?,? = 1 5 Now, we can use bootstrap to estimate properties of the eigenvalues and eigenvectors of the covariance matrix 22
Why should we be interested in the eigenvalues and eigenvectors Suppose that we think on model for the test results ??= ??? + ??, ? = 1 88 If this model is true, we would approximately expect that the first eigenvector of the covariance matrix will be equal to V, and that the eigenvalues ?1will be positive and ?2= ?3= ?4= ?5= 0 ?1 5 Now let ? be ? = ?? ?=1 Large value of ? is indicating a high degree of explanatory power for the model above Actually, the eigenvectors are the principal components of the data 23
Estimating the accuracy of? Create B 88x5 matrixes ? , where the rows of ? are a random sample from the rows of the actual data matrix X. and find ?? create the empirical covariance matrix ?? based on the For each ?? ?1 5 ?? = following: ?? ?=1 Now we can estimate the standard error of ? as we saw before Based on asymptotic theory we can now create a confidence interval for ? ? ? ? ???( ?) in an 1- confidence level ?1 ? 2 24
Regression problem Suppose that in our population we have two variables Z and Y, by definition the regression of a response variable y on an explanatory variable z is the conditional expectation of y given z: ? ? = ?(?|?) If we had available the entire population (and also let us suppose Z is discrete) then for each value z the regression would be the conditional expectation: ? ? ??? ?? ???????? ??? ??????? ?? ? ? ?????????? ??? ??=? ?????? ?? ??????? ?? ? ? ?????????? ??? ??=? = So, for a sample an obvious plugin estimate (for non parametric bootstrap) is: ??? ?? ???????? ??? ??????? ?? ? ? ?????? ??? ??=? ?????? ?? ??????? ?? ? ? ?????? ??? ??=? good idea??? ? ? = 26
The nonparametric plugin estimate is usually not a good idea for this problem The model: ? = 3 + 2 ? + 5 ?2+ ?3 ?4 ? 1 ?~? 0,22, 2+ ? ?? ? = = 101,i 100 = 1..100 n = 170 27
Let us focus on the other solutions to the regression problem - Quadratic least squares linear regression Let us define ??? = ?0+ ?1? + ?2?2 Now we to minimize ??? ? = ?=1 [?? ????]2by ? ? ? = min So ???(?) ? We can think on ??? as a smoother version of the plugin estimator As we considered higher degree polynomials ? ?(?) would more and more resemble to the plugin estimate ?(?) 28
Let us focus on the other solutions to the regression problem - Weighted least squares linear regression (loess) we choose a number ? that will be the proportion of the n data points used at each point of the curve construction At each point ? we choose the closest ? ? points "?(?) A weighted least squares linear regression ??? = ??,0+ ??,1? ??,0 ??,1 and are different at each point ? and are selected to minimize ?? ? ???,?[?? ?0+ ?1??]2in each ? Where ??,?are positive numbers which depend on |?? ?| |?? ?| max ?(?)|?? ?| ??= (1 ??3)3 ??= 29
Using bootstrap in order to estimate parameters of the two curves - 1 Suppose that we are interested in only a few points (for example ? = 0.6 and ? = 1) We can expect that ??[ ?????? ] will be higher then ??[ ??????? ] since the weighted least squares is based on less data then the quadratic least squares We can verify it (and see the estimated differences) by estimating each model standard deviation (in a certain point ?), by using nonparametric bootstrap (by sampling pairs of y and z) to estimate [ ?????? ] and ??[ ??????? ] by the estimators ???[ ?????? ] and ???[ ??????? ] 30
Using bootstrap in order to estimate parameters of the two curves - 2 Now, let s Suppose that we are interested in ? =? 100 ?(80) ? 80 ?(60) 20 20 Since weighted ls much more flexible we expect it to be much less biased then the quadratic ls Now, if want to know what are reasonable values of ?, we can use nonparametric bootstrap to create B bootstrap values ?????? Now we can create a histogram of reasonable values for ?, and see whether ????? is a reasonable estimator If ?????is not reasonable we will might want to fit a more flexible model (cubic, quartic, etc ) and then estimate ? 31
Example from uniform distribution Suppose that we have data ?1, ,??from a uniform distribution (0,?) ????= ?(?) Let us suppose we want to estimate the standard error of the MLE ?? ????? Do you think nonparametric Bootstrap is good way to estimate 33
Sometimes the empirical distribution ? estimate for F example from uniform distribution is not a good We computed 50 observations from ?(0,1) distribution, and now we want to try and compare the distribution of ? ???to the distribution of ????and see if ??? ???? ?? ???? is a good estimator for ??3000 ???? ?? ???? 0.0189 = 0.0278 34 ???? ? ???
A use of parametric bootstrap can help us built a better ? Now we will choose a parametric setting where ? is a uniform (0, ????= 0.992) and will get much better results An example to how different the parametric and non parametric are can be found in ? that under nonparametric bootstrap ?? ? ???= ???? = 1 1 1 1 ?= 0.368, ? and under parametric bootstrap ?? ? ???= ???? = 0 ??3000 ???? = 0.0196 ?? ???? 0.0189 ??3000 ???? = 0.0278 35 ??? ?????????? ? ?????????? ? ???? ??? ???
Thank you 36