Estimating Population Mean Movie Average Shot Lengths Using Bootstrap
Learn how to estimate the population mean of movie average shot lengths using the Bootstrap method. Understand the process of sampling, estimating, and obtaining the sampling distribution, along with its properties.
Download Presentation

Please find below an Image/Link to download the presentation.
The content on the website is provided AS IS for your information and personal use only. It may not be sold, licensed, or shared on other websites without obtaining consent from the author. Download presentation by click this link. If you encounter any issues during the download, it is possible that the publisher has removed the file from their server.
E N D
Presentation Transcript
Application of the Bootstrap Estimating a Population Mean Movie Average Shot Lengths Sources: Barry Sands Average Shot Length Movie Database L. Chihara and T. Hesterberg (2011). Mathematical Statistics with Resampling and R. Wiley, Hoboken, NJ.
Data Description Average Shot Length (seconds) for a population of 11001 films (Barry Sands movie database) Very highly right-skewed population. Min=1.330 LQ=4.510 Median=6.400 UQ=8.910 Max=1000 = 7.739 = 12.765 Coefficient of Variation: CV=100(12.765/7.739)=164.94% Goal: Small sample estimation of with unknown small- sample sampling distribution of sample mean (in terms of shape)
Introduction to the Bootstrap Makes use of a sample from a population to estimate the sampling distribution of a statistic/estimator. Treats the sample as an estimate of the population of measurements (sample empirical cumulative distribution function as estimate of population cdf) 1 if 0 otherwise y y 1 N N ( ) = = = i Population empirical cdf: ( ) 1 1 F y P Y y y y y y i i = 1 i 1 n n ^ = = Sample empirical cdf: ( ) 1 Proportion of sample measurements at or below F y y y y i = 1 i 1 n n ^ f y = = Sample empirical mass function : ( ) 1 Proportion of sample measurements equal to y = y y i = 1 i 1 n n ^ Y = = = = ( ) E y f y y y i ^ F ^ F = 1 i ) ( ( ) 1 n 1 n n 2 2 Y = = = = 2 2 V E Y y y s i ^ F ^ F ^ F ^ F n = 1 i
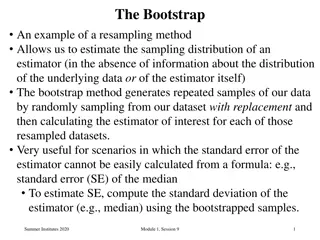
Applying the Bootstrap Obtain a random sample of size n from the population Determine the estimator(s) of interest Compute the estimate(s) based on the sample: Determine B, the number of bootstrap samples to be taken Obtain B random samples of size n from the original sample with replacement Compute the estimate for each bootstrap sample: The bootstrap distribution is the collection of estimates The bootstrap standard error is the standard deviation of the estimates ^ * ^ i
Properties of the Bootstrap Sampling Distribution Center: The center of the bootstrap sampling distribution is the estimate based on the full sample, not the population parameter it is estimating Spread: The spread is representative of the spread of the estimator s sampling distribution Bias: Represents the difference between the center of the bootstrap sampling distribution and the true parameter the estimator is used for. The bootstrap bias estimate is accurate for the true bias. Skewness: Skewness in bootstrap sampling distribution is representative of the skewness of the estimator s sampling distribution
Example Movie Average Shot Lengths (ASL) Interested in approximating the sampling distributions of the sample mean. Population value: = 7.739 (Pseudo) Random sample of n=25 films ASLs: 4.40 14.98 7.80 9.50 9.50 6.70 7.50 9.20 3.70 8.04 4.47 9.40 8.40 8.88 5.50 16.30 6.70 3.65 4.27 11.60 9.30 3.40 2.90 12.00 16.60 = = = 8.1876 3.8945 2.064 95% CI for : y s .025,24 t 3.8945 25 8.1876 2.064 8.1876 1.6076 6.5800,9.7952
Bootstrap Samples Taking B=10000 bootstrap samples from the original samples. Summaries for original sample, mean, sd, CV: > summary(ASL.sample1) Min. 1st Qu. Median Mean 3rd Qu. Max. 2.900 4.470 8.040 8.188 9.500 16.600 > summary(ASL.mean) Min. 1st Qu. Median Mean 3rd Qu. Max. 5.560 7.666 8.182 8.190 8.687 11.100 > summary(ASL.sd) Min. 1st Qu. Median Mean 3rd Qu. Max. 1.916 3.423 3.800 3.772 4.137 5.494 > summary(ASL.CV) Min. 1st Qu. Median Mean 3rd Qu. Max. 26.19 42.28 46.19 46.16 50.13 67.20
Bootstrap Standard Error and Sampling Distribution In terms of the sampling distribution of the sample mean: Mean of bootstrap sample means: 8.1899 (Close to original sample mean (8.1876), not so close to population mean (7.7394). Bootstrap estimate of bias: 8.1899-8.1876=0.0023. Bootstrap standard error: Standard deviation of the 10000 bootstrap sample means: 0.7620. Bias/BSE=.0023/.7620=.0030 (0.30%) Bootstrap 95-percentile interval: (.025,.975) quantiles of the bootstrap mean sampling distribution: (6.7444,9.7113) which does include the population mean (7.739) Note: Interval is of the following form (reflecting an asymmetric bootstrap sampling distribution: ( ) + = 1.4452, 1.5257 8.1876 y y y
Bootstrap t Confidence Interval for Y S = Consider the -statistic: If data are normal, then ~ t T T t 1 n / n Data not normal, want to approximate 0, 0 where: Q Q L U S S ( ) = = 1 P Q T Q P Y Q Y Q L U U L n n * Procedure: replace with , with Y (bootstrap sample means), and y y i * i with (bootstrap sample SDs): S s * y y n = / 2 quantile) and / 2 quantile) of the * i * L * U * i and obtain (the (the 1- i t Q Q t * i / s Bootstrap t (1- )100% Conf idence Interval for : s s y Q * U * L , y Q n n
ASL Example 2.3352 = = = = = 1.8496 8.8176 3.8945 25 Q Q y s n L U 3.8945 25 3.8945 25 8.8176 1.8496 ,8.8176 2.3352 + 95% Bootstrap CI for : t 6.7649,10.0065
Comparison of 3 Methods 95% CI for Repeat methods described previously, based on each of M=1000 random samples from the original population. Obtain empirical coverage rates for each method based on the M=1000 random samples, with B=1000 bootstrap samples per random sample of n=25. Method 1: (t-interval based on normality assumption): Coverage Probability: .869 Average width: 5.05 seconds Method 2: Bootstrap Percentile Interval: Coverage Probability: .849 Average width: 4.40 seconds Method 3: Bootstrap t Confidence Interval: Coverage Probability: .903 Average width: 22.23 seconds


