Essential Hazard Assessment Techniques and Tools
Hazard assessment methodologies like hazard bag, mapping, and analysis to identify risks in communities. Understand the importance of hazard/risk mapping and the procedures involved in prioritizing hazards. Utilize participatory tools and techniques to assess and address potential hazards effectively.

Download Presentation

Please find below an Image/Link to download the presentation.
The content on the website is provided AS IS for your information and personal use only. It may not be sold, licensed, or shared on other websites without obtaining consent from the author.If you encounter any issues during the download, it is possible that the publisher has removed the file from their server.
You are allowed to download the files provided on this website for personal or commercial use, subject to the condition that they are used lawfully. All files are the property of their respective owners.
The content on the website is provided AS IS for your information and personal use only. It may not be sold, licensed, or shared on other websites without obtaining consent from the author.
E N D
Presentation Transcript
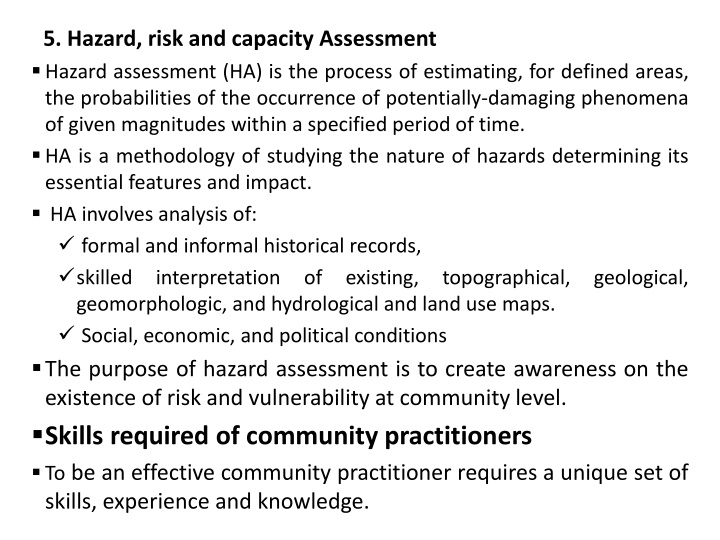
5. Hazard, risk and capacity Assessment Hazard assessment (HA) is the process of estimating, for defined areas, the probabilities of the occurrence of potentially-damaging phenomena of given magnitudes within a specified period of time. HA is a methodology of studying the nature of hazards determining its essential features and impact. HA involves analysis of: formal and informal historical records, skilled interpretation of existing, geomorphologic, and hydrological and land use maps. Social, economic, and political conditions The purpose of hazard assessment is to create awareness on the existence of risk and vulnerability at community level. Skills required of community practitioners To be an effective community practitioner requires a unique set of skills, experience and knowledge. topographical, geological,
A good understanding of the community group and geographic area in social, economic, political and environmental issues Experience in guiding participatory learning processes Familiarization and experience of using PRA techniques, and A belief in dialogue and a respect of the values, customs and principles of others Methodology and Tools used for hazard assessment The methodology may be group discussions, transect walk, application of participatory tools, brainstorming, etc. Participatory tools used for hazard assessment include: Hazard bag Hazard/risk mapping Hazard ranking/pair-wise matrix/pilling matrix Hazard analysis Hazard calendar
Materials: Local materials such as sticks, stones, seeds etc. for mapping on the ground or appropriate writing materials if communities are comfortable with these. Time: 2-3 hours Procedures of hazard assessment The procedures of hazard assessment are need to be put in sequence. Establish a common understanding of the term among participants in a joint session. Divide groups by gender, age, social status, etc. A Hazard Bag Brainstorm on important hazards and list them. Ask each group to come up with a list of hazards that are of importance to them. These will be combined and called hazard bag. Prioritization methods are then used to gauge the importance of these hazards to the community.
Hazard/Risk Mapping Hazard mapping is the presentation of the results of hazard assessment on a map, showing the levels of expected losses which can be anticipated in specific areas, during a particular time period, as a result of particular hazards. It is the process of establishing geographically where and to what extent particular phenomena are likely to pose a threat to: people, property, infrastructure and economic activities. Essential information in hazard assessment among others includes: Nature of the hazard Location and spatial area Depth of the hazard Type of hazard: natural or man-made, Warning signs: scientific or indigenous indicators (cloudy skies, movement of animals, temperature, weather pattern, etc.)
Force : intensity or magnitude, Speed: on-set and impact (very fast, very slow, etc.) Frequency: how often does the hazard strike (once a year, every month, once in 10 years, etc) Duration: how long does the hazard event last (1 day, 2 hours, 60 seconds, etc) Prioritization of the hazards shown in the sample to determine their order of importance to the community. A ranking tool such as the proportional piling method can be used and also drawn on the ground. This work can be done on the ground using local materials to represent hazards.
Decision tree yes Consider it Do not include in your analysis likely unlikely Will it happen? And think of ways to manage it
Piling Matrix Hazard type Score (sticks) Rank 2 Drought 1 HIV/AIDS 3 Insecurity 4 Flood
Exercise Hazard Symbols Score Rank Drought 5+5+5+5+5+5+5+5+5+5+5+5 60 1 Flood 1+3+3+2+2+1 26 5 Human disease 2+4+4+1+1+3+4 32 2 Livestock disease 4+2+2+3+4+2+3+2+1 29 3 Conflict 3+1+1+4+3+4+1+4+3+4+1 28 4
Pair-wise ranking Hazard Drought Flood H.D L.D Conflict Scor e Rank Drought - dddff dddhhh dddddd d Flood - - hhfff l c Human disease - - - lhh h Livestock disease - - - - l Conflict
Seasonal Calendar The seasonal hazard calendar is another tool that can be used to analyze hazards. Its purpose is to bring out seasonal variations in community's vulnerability to different hazard and community's ability to cope in different seasons. It also enables the community focus on different hazards at different times depending on their prevalence. Seasonal Hazard Calendar Vulnerability Seasons Hazard Capacity Vulnerability Vulnerability elements conditions June-August floods People, crops, Low, high, economic, social, animals, resources skill, physical, etc Sept-November hailstorms, matured crops malaria Dec-February drought people, animals, water, vegetation March-May drought
Sample Hazard Trend Analysis Matrix Time Place A Place B Place C Place D Place E Place F Hazard (period) (period) (period) (period) (period) (period) Drought Frequency Severity
Exercise During the period 1991-1995 and 1996-2000, drought occurred in district X with varying effects across villages and time. During the first period, drought occurred twice and killed 10 people, 200 goats and 20 camels in village A . During the same period, the problem was more severe in village B . In this village, drought occurred three times and claimed the lives of 30 people, 500 goats and 40 camels. In the second period, drought disrupted the livelihood systems of the community in the villages. While the problem, which occurred three times killed 30 people, 500 goats and 50 camels in village A , it killed 20 people, 400 goats and 30 camels in village B . 1.Do hazard trend analysis 2.Indicate the risk for the period 2001-2005 and 2006-2010
Village A Village B Drought 1991- 1995 1996- 2000 2001- 2005 2006- 2010 1991- 1995 1996- 2000 2001- 2005 2006- 2010 Frequency 2 3 4 5 3 3 3 3 Severity People Goats Camel 10 200 20 30 500 50 90 1250 125 270 3125 312 30 500 40 20 400 30 10 300 20 0 200 10
Hazard Analysis/Hazard Tree Before we can start to design a project, we need to analyze the hazard identified using various assessment tools. Hazard analysis examines the negative aspects of an existing situation and establishes the cause and effect relationships between the hazards that exist. It involves the following steps: 1. Identification of the stakeholders affected by the hazard 2. Identification of the major hazards faced by community members 3. Development of a problem tree to establish causes and effects Why do we lose? Why? Poor defence Why? Poor tactics poor skills
Hazard Analysis Planners/community development practitioners use a problem tree analysis technique to identify all the issues surrounding a given problem and displaying this information as a series of cause and effect relationship. A problem tree approach can also be used for a general diagnosis of a problem in some situation or organization. In this case no specific problem needs to be taken as the starting point. Instead, all existing problems are identified and then interrelated in the cause and effect linkages for the situation as a whole. The hazard analysis begins with identifying a core problem (the trunk). The tree is then expanded upwards and downwards as the causes and effects of the problem are identified. From these, a starter problem is selected, and a second problem related to it, then: if the problem is a cause it goes on the level below if it is an effect it goes above if it is neither a cause nor an effect it goes on the same level
Hazard Tree Branches Branches Branches Trunk Roots
Hazard Analysis A hazard analysis identifies all problems related to the main issue and ranks them hierarchically. The analysis, usually a brainstorm exercise, identifies issues and problems that are of priority to the parties involved. As such, representatives of all local communities, formal and informal groups, concerned organizations, government, and other actors should contribute to this analysis. Problem analysis, objectives analysis, and the subsequent steps in project design to curb a problem are best carried out through participatory workshops with an experienced planner and facilitator. By designing a project based on real, existing problems of the parties involved, the project designers can avoid imposing their pre-conceptions about the desirable objectives of the intervention. The most common difficulty that arises during the hazard analysis are inadequate hazard specification. Inadequate problem specification occurs when the detail of the formulation is insufficient, so that it does not communicate the true nature of the hazard.
Hazard Analysis Overly general statements will need to be broken down. Obviously, getting the level of detail right is a matter of judgment on the part of the facilitator and the participants. Hazard trees enable stakeholders to get to the root of their priority need and to investigate the effects of the problem. METHOD OF CONSTRUCTING A HAZARD TREE STEP 1: Agree on the main hazard. Write it on and post it in the middle of the wall using a piece of card. There might be other problems identified by the community that could be expired. Draw separate problem trees for these and compare them later when starting to think about exactly what the intervention will address. Begin with the specific problem or need to be solved. List all other interdependent conditions and problems. Brain storming or other group s idea generating techniques can be used, or simply ask the following questions for each problem as it is identified: Identify major interest groups involved Involve a representative of each, if at all possible, in your analysis of problems.
Hazard Analysis If not possible, try to perceive from each of their perspectives as described in the participation analysis section. List as many problems as possible from each of the above perspectives, remembering that a problem is not the absence of a solution but the difference between what is desired and what the current state of affairs is; For each of the problems you have listed above ask yourself what are (could be) the major causes. What is this problem caused by? What does this problem cause? To ensure a more complete diagnosis, include as many relevant perspectives as possible as discussed in the participation analysis earlier. STEP 2: Identify the causes of the main problem by asking But why?
Hazard Analysis Shortage of finance But why? But why? But why? But why? But why? Nothing to sell Few jobs Poor yields Local factory immigration
Problem Analysis Step 3: Identify the effects of the main problem by asking so what? Write each effect on a separate post it note or piece of card. Some problems might have more than one effect. For example: Crop yields decrease So what? No money to buy new seeds So what? Lack of income Developing a problem tree (Effects)
Hazard Analysis Encourage discussion and ensure that participants feel able to move the post-it notes cards around. Check through the problem tree to make sure that each problem logically leads to the next. Step 4: Copy the problem tree on to a sheet of paper. Draw in vertical links to show the relationship between the causes or effects. Draw horizontal lines to show where there re joint causes and combined effects.
Children stop going to school Poorer nutrition Reduced incomes Increased mortality Less money for school fees Less time for farm work Increase d disease Buy water Use dirty sources Increased Cost of water collection Effects Water shortage Causes Hand pumps broken Increased dd for farm use Not enough wells Open wells Dried up Increased dd for hh use Water- intensive Farming methods Population pressure Example of a simple problem tree
Hazard Analysis To begin the problem analysis, the group checks the validity of the formulation of each problem, asking: Are the problems precisely worded, and their meaning understood by everyone in the group? Are they real? Only one problem per card? No hidden or absent solutions? Are any information gaps marked? Are the cause-effect relationships logical and complete? Have any intermediate steps been left out? Then any necessary changes to the tree are made. When the group is satisfied with the relationships, the lines tracing these relationships are drawn. This completes the problem analysis Note that problems identified should be continuously monitored during project implementation.
migration conflict Death of livestock malnutrition Effects Land degradation Core problem/trunk: lack of pasture Locust invasion Lack of rain Roots overgrazing Invader species Lack of proper management Stock number deforestation Wild fire
Sustainable life Permanent settlement Health Enhancing water availability Strategy 1 Strategy 2 Digging wells Rehabilitation of ponds Water management afforestation Exercise: Objectives Tree
Vulnerability Assessment Purpose To analyze the extent of vulnerability and risk for different members of the society to various hazards. Develop understanding as to why communities and individuals are vulnerable Methodology Group discussions and application of participatory tools Materials Local materials such as sticks, stones, seeds etc. for mapping on the ground and writing materials to record these upon completion of the exercise. Time: 2-3 hours Procedure The purpose of this session is to help the community members understand why they are vulnerable to various hazards. The community members will critically look at various elements i.e. human, assets, infrastructure and physical features that are more vulnerable to prevalent hazards.
Vulnerability Assessment Vulnerability assessment is the methodology of identifying who and what will be affected, and who will need assistance. The following participatory tools can be of assistance in facilitating vulnerability assessment Risk Map is a physical map of the location of the community. It shows the main physical features and areas of risk to various hazards. The map is drawn on the ground and should be put on paper later by either a literate member of the community or the facilitator. This map shows the locations where risk to particular hazards is higher to members of the community. It is therefore, helpful to the extent of highlighting appropriate intervention points within the community.
Vulnerability Assessment COMMUNITY MAPPING OF RISK Once the map has been drawn, encourage discussion by asking questions such as: What are the most important parts? To gain greater understanding, the groups should work differently What are the areas of disagreement?
The next step is to look at what makes people vulnerable to specific hazards and to determine who these vulnerable people and elements are. This can be done in a participatory session where community member's work on a tool called a Vulnerability Triangle. Questions: Who are most vulnerable to drought? From the figure given above, it is possible to observe that children are more vulnerable to drought, followed by the elderly, women and men in the order of mention. How many are those who are most affected by the disaster or what proportion does each category make?
Vulnerability Triangle/pie-chart Women 20% Children 40% Men 15% Elderly 25%
Vulnerability Assessment TRANSECT WALKS: Instead of being shown the bestfarms and the bestclinics , plan a transect walk to provide a good picture of the area. Walk though the community with key informants, observing, listening and asking. The questions could be open-ended. It is important to have a clear idea about what we are looking for so we can make sense of the answers Try walking in a fairly straight line through the area, making a careful note of whatever is relevant, e.g: the soils, agriculture, water sources and activities. Draw the findings on to a diagram like the one below.
Vulnerability Assessment Lower slope Middle slope Sorghum Maize Farming Grazing Erosion Low soil fertility No nearby water Erosion control Use of manure Tree planting Mountain Sorghum Maize Pigeon peas Farming Grazing Land shortage Paid labor on estates Tree nursery Crops Trees Grazing Cutting trees Deforestation Land use Problems Opportunities
Vulnerability Assessment SEASONAL CALENDARS: are used to show month by month changes of subjects like rainfall, labor, diet, sickness and prices, ask community members when their year starts, the names of the months and seasons and choose which to use. Mark the units on the ground or on paper. Using stones or beans, ask them to indicate the amount of whatever subject is being discussed. For example, allow them to place up to ten beans for each subject for each month. Encourage people to discuss until they are in agreement. Ask questions about why the numbers vary. TIMELINE: A timeline is used to show major local events, ecological change, disease and population trends. Agree how many years to timeline should cover. Draw a horizontal line on a large piece of paper and write the year along it. Ask community member to discuss key events and to write them in. The example below is a timeline of well-being, which is used to reflect on the well- being of the community in recent years. Events that influenced well-being are included.
Vulnerability Assessment Good Good Harvest Good harvests Built animal crush, Moderate rains Built food stores classrooms and teachers houses shallow well dug Moderate rains Rehabilitated 2 classrooms Ok G 1995 1996 1997 1998 1999 2000 2001 2002 Rains spoilt crops Built pit latrines and Bad tanks Drought starvation 5km to collect water Stealing of cattle migration from lake No rains walked
Targeting elements at risk Purpose To assist the community to target various categories and individual within the vulnerability bracket with respect to specific hazards. To use community knowledge and resources for improved targeting. Methodology Group discussions and the application of participatory tools Procedure The process of targeting should be useful in assisting the community to know the particular individuals/households or elements at risk to a particular hazard. It should also be a tool to determine actual levels of vulnerability of households or individuals. This is necessary not only for deciding appropriate action, but also for directing and apportioning it according to actual needs of the people
The actual work of targeting will depend on various factors including the hazard being addressed, the phase of the disaster at the time of targeting and available resources to carry out the process. However, to be meaningful the process should be: Undertaken through a participatory approach that ensures community involvement. Ideally, it should be community-led. Easy to undertake i.e. not cumbersome and time consuming to the extent that it negates plans for swift action. Possible to operate within a framework where sustainability is inbuilt. Below is an example of a participatory approach to targeting in a drought/famine situation in arid environments. The process can be undertaken through the following steps.
Step 1: In a brainstorming session, the community discusses the various elements or categories that are at risk. The outcome of this will be a broad list that includes both those that are already suffering and those that are only facing the threat. Step 2: The community determines the target unit. The decision is taken either to target on a household or individual basis. Here, consideration on the impact and logistics can be determining factors. Step 3: The community agrees on indicators of vulnerability at the target unit. This is then developed as a checklist that will be used for ranking as vulnerability analysis data. Step 4: On the basis of broad knowledge, the community selects and lists target units that are seen to have a likelihood of being vulnerable. Step 5: Using the vulnerability analysis checklist developed in step 3, target units are ranked against indicators of vulnerability. The outcome of this is a rational order that can be used to prioritize action at target unit level.
Step 6: The community now looks at various actions that can be undertaken to address the problem posed by the hazard. It would be appropriate to refer to the outcome of the vulnerability analysis checklist. The community suggests several actions and ranks them to select the most appropriate. This can be done using the Pair-Wise Ranking Matrix. An example is shown below. Here, the community will be able to weigh intended actions against each other and chose the best out of the list. In the above example, the supplementary feeding of livestock was chosen as the most appropriate measure. Sample of a Pair-Wise Ranking Matrix Livestock off-take Supplementary feeding of livestock Score Rank Actions Maintenance of boreholes Livestock offtake Livestock off-take 2 2 Supplementary feeding of livestock 4 1 Supplementary feeding of livestock Supplementary feeding of livestock Supplementary feeding of livestock Livestock off-take 0 3 Maintenance of boreholes Supplementary feeding of livestock
Step 7: This step involves a critical view of the capacity to intervene. The capacity should be looked at from both the external and internal angles. It is basically asking and answering the questions of whom and what is there? Step 8: Having determined their capacity to intervene, the community can now do the actual selection of the particular target units according to the outcome of step 5. Selection is done on the basis of priority levels already established through the vulnerability analysis checklist. Step 9: The community will focus on each target unit separately to determine actual need. This entails looking beyond what makes the unit vulnerable to how vulnerable it actually is.
Sample Checklist Name of the unit: Date of the interview: Parameter Achieved Requirement % Achieved % Shortfall Number of meals per day Quantity consumed per day of food Variety
Step 10: The community should look into ways of having a sustainable community-based structure to implement action for the benefit of the selected beneficiaries who also should form a substantial part of this group. This is especially necessary in the absence of an existing institution that the community can identify with. After establishment, the community should define the mandate of this body as a guideline for their function. Step 11: The last step is to draw a plan of implementation for the activity. This should define time, roles and responsibilities of individuals and organs and the resources required to meet specific objectives and targets.
Community Capacity Assessment It involves two things: resource analysis and capacity assessment The purpose is to analyze community risk reduction capacity. Methodology Participatory tools where participants work in groups corresponding to the number of hazards Materials Local materials for drawing on the group or appropriate writing materials Time: 4 hours Procedure The purpose of this session is to provide an opportunity for participants to critically consider both the external and internal capacities/resources that the community relies on for risk reduction. Participants will consider each hazard and the relevant risk reduction resources to see how the community relies on these resources and who controls these resources. Below are examples of participatory tools that can be of use in this session;
Resource Analysis Definition Resource: capability and means of support that people draw on, such as economic resources, social resources, environmental resources and natural resources. Procedure Establish a common understanding of the term resource(s) among participants in joint session. This can be done through brainstorming. Ask each group will select one of the hazards mentioned and list the resources that the community has that could be used to overcome the disaster. Internal and external resources are listed separately. The outputs for all groups will be put together and called the Community Resource Bags (one for external and one for internal resources). Divide participants into two groups and let one group draw a map of the area and depict the mentioned resources where they are normally found. This is called a Resource Map.
Resource Maps In capacity and resources assessment, the most important consideration is how far away the resources are and the condition of access This helps gauge the timeliness and accessibility The example of a resource service map can be used as a tool to assist the community Hazard conditions here are human diseases The particular service each particular center offers and the actual mode of transportation have to be considered Consider resources bags, resource maps and resource service maps X referral hospital Resource bag 2 days Drug store Woreda drug store 1 day Fig. Resource service map Z hospital community
Capacity Assessment: - to identify strengthes and weaknesses It involves five types of assets Human- skills Social-relationships, political structures, community centers, schools Natural-land, trees, water, air, climate, minerals Physical-transport, water, sanitation, energy, buildings, telecommunication Economic-money, savings, revolving funds, grain stores It also involves stakeholder analysis In assessing the reliability and adequacy of community capacity, a matrix can be used as shown below. It attempts to answer the following questions: What resources are there for reduction of risk for each disaster? What is the extent of reliability and adequacy of these resources? And are there possibilities for improved risk reduction through the said resource? 1. Participants agree on rating. In this case, the asterix (*) represents 10%. Thus the maximum rating is 100%. 2. To come up with a rating, participants discuss and reach a consensus. Note that total risk reduction per hazard may not be 100%, since it remains impractical to eradicate risk.
Resource Matrix Hazard Drought Insecurity Risk reduction resource Risk reduction potential at maximum Portion of capacity in use Factors limiting maximum risk reduction potential Livestock market Pasture reserves Government Elders ***** = 50% * = 10% * * * = 30% * = 10% = 50% 0% ** = 50% 0% Government policies. Livestock diseases. Lack of adequate water resources. Conflict Corruption. Politics. Weakened traditional systems. L.ick of social cohesive ness. Build capacity of traditional institutions. Possible measures to improve risk reduction potentiality Advocate for change in policy. Streamline community based Develop strategic water facilities. Conduce conflict resolution. Increase awareness on rights issues. Conduct civic education. approaches to control livestock diseases.
Wealth Ranking Members of the community should develop criteria that classify the households in wealth rank. The members may use landholding, ownership of livestock and, housing quality to measure the wealth status of households. Members of the community may compare the wealth status of all households of the community in reference to households in other similar communities.
Indicators of wealth status Rich 3 hectare of land Medium 1.25 to 2 hectare of Poor 0.75 Very poor 0.25 to to Four oxen land 1hectare of 0.5 10 beehives Two oxen land hectare 4 cows 6-10 beehives An ox With no Some goats 1-2 cows 1-2 goats ox One donkey One donkey One donkey With no A house made of A house made of Grass cow corrugated Iron Iron corrugated thatched hut 1-2 goats sheet 3-4 goats