Declining Competition and Industrial Disruption Study
Research conducted by James Bessen, Erich Denk, Joowon Kim, and Cesare Righi focuses on the trends in competition and industrial disruption, with a specific emphasis on the hazard of displacing top firms, impacts of investments by dominant firms, and the relationship between displacement hazard, markups, and industry concentration. The study reveals a rise in displacement hazard post-1970 followed by a decline after 2000, negative correlation with investment in intangibles like software, and associations with higher markups and lower industry concentration.
Download Presentation

Please find below an Image/Link to download the presentation.
The content on the website is provided AS IS for your information and personal use only. It may not be sold, licensed, or shared on other websites without obtaining consent from the author.If you encounter any issues during the download, it is possible that the publisher has removed the file from their server.
You are allowed to download the files provided on this website for personal or commercial use, subject to the condition that they are used lawfully. All files are the property of their respective owners.
The content on the website is provided AS IS for your information and personal use only. It may not be sold, licensed, or shared on other websites without obtaining consent from the author.
E N D
Presentation Transcript
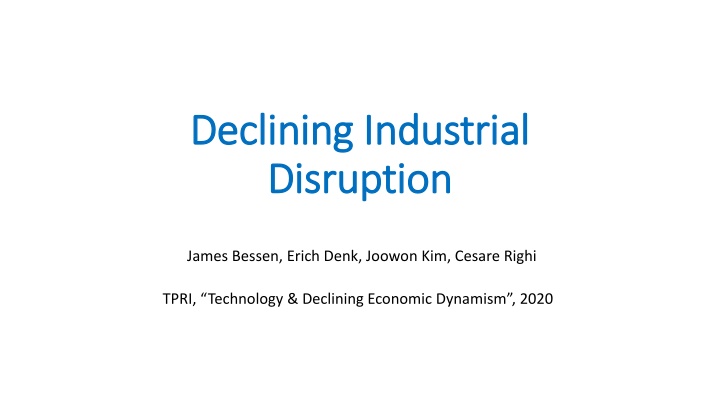
Declining Industrial Declining Industrial Disruption Disruption James Bessen, Erich Denk, Joowon Kim, Cesare Righi TPRI, Technology & Declining Economic Dynamism , 2020
Is competition declining? Is competition declining? Markups rising? Industry concentration rising? Markups measure price competition Not dynamism
Price competition Price competition Schumpeterian competition Schumpeterian competition Innovative firms earn rents on technology markups Why competition matters Price competition static deadweight loss Schumpeterian competition productivity growth Measuring industry dynamism Entry rates Growth rates of innovative firms Displacement of market leaders
This paper This paper 1. What are trends in hazard of displacing top firms? 2. What investments by dominant firms affect displacement? 3. Is displacement hazard related to markups and industry concentration?
This paper This paper 1. Hazard of displacing leading firm rose since 1970 but fell sharply after 2000 2. Displacement hazard negatively related to investment in intangibles, software Accounts for much of decline 3. Displacement hazard associated with higher markups, lower industry concentration
Data Data Compustat, 1976-2017, global, publicly listed Peters and Taylor (2016) intangibles Advertising Patents Lobbying Software Acquisitions NETS, 1990-2014, US, private & public ACES, 2002-2012, US, private & public [not disclosed]
I. Dominant firm displacement I. Dominant firm displacement
II. Displacement & Investments II. Displacement & Investments
IO models: investments IO models: investments market share market share Cournot: investments in capacity Sutton, endogenous sunk costs: investments in quality, differentiation Investments by acquisition Regulation: investments in lobbying
IO models: investments IO models: investments market share market share Cournot: investments in capacity Sutton, endogenous sunk costs: investments in quality, differentiation Investments by acquisition Regulation: investments in lobbying Q: Which investments associated with change in displacement?
Basic model: Duopoly Basic model: Duopoly Revenue Production function (reduced form) ???= ????( ???,? ?? A = productivity; stochastic, dynamic K = Beginning of year capital variable inputs adjust K-i= other firm capital; externality
Leapfrog ?( ???,? ?? ?( ? ??,???
Assume Assume Shocks independent (Sutton 2007) and normal; Markov process ln???= ???+ ???~? ???,??, ? = 1,2 Cobb Douglas, ln? = ?1ln???+ ?2ln? ?? ?2? ?1?+ ln? ?2?,?1? ln ?(?1?,?2? ? ?2?< ?1? = 2??
Probability of leapfrog / dropout Probability of leapfrog / dropout ???= ??+ ??+ ??+ ?1ln???+ ?2ln? ??+ ???. Linear approximation ?? industry FE ?? captures changes in volatility, ?? ?? absorbed into ??? Multiple firms Top 4 Second 4 (ranked 5-8) Multiple capital stocks
Identification Identification ???= ??+ ??+ ??+ ?1ln???+ ?2ln? ??+ ???. ?? unobserved & possibly correlated with ??? Obtain ??? from productivity function estimation (ACF) ???= ??+ ??+ ???+ ?1ln???+ ?2ln? ??+ ???. Robustness: bootstrap errors
Displacement Hazard of Top 4 firm 1 4 5 Base <=2000 1976-2000 >2000 2001-2017 1976-2017 Productivity -0.019 (0.018) -0.029*** (0.003) -0.102*** (0.031) -0.043*** (0.004) -0.032 (0.023) -0.023*** (0.005) Net PPE Intangibles -0.026*** (0.003) -0.030*** (0.004) -0.032*** (0.005) Industry FE Year FE Industry x year FE Observations Adjusted R-squared x x x x x x 26471 15936 10535 0.091 0.109 0.091
Displacement Hazard of Top 4 firm 1 4 5 Base <=2000 1976-2000 >2000 2001-2017 1976-2017 Productivity -0.019 (0.018) -0.029*** (0.003) -0.102*** (0.031) -0.043*** (0.004) -0.032 (0.023) -0.023*** (0.005) Net PPE Intangibles -0.026*** (0.003) -0.030*** (0.004) -0.032*** (0.005) Industry FE Year FE Industry x year FE Observations Adjusted R-squared x x x x x x 26471 15936 10535 0.091 0.109 0.091
Top 4 firm moves down Second 4 firm moves up Hazard: Firm interactions -0.006 (0.021) -0.033*** (0.004) -0.035*** (0.004) 0.090*** (0.022) 0.039*** (0.003) 0.032*** (0.003) -0.001 (0.004) -0.002 (0.004) -0.011*** (0.004) -0.014*** (0.004) -0.014*** (0.004) -0.004 (0.004) -0.005 (0.005) -0.006 (0.004) Subject firm Productivity Net PPE Firm 1 Intangibles Tangible Capital Firm 5 0.004 (0.003) 0.001 (0.002) -0.001 (0.003) -0.002 (0.002) Firm 6 Firm 2 Firm 7 Firm 3 Firm 8 Firm 4 Intangible Capital Firm 5 Firm 1 -0.001 (0.002) 0.003 (0.003) 0.002 (0.003) 0.004 (0.003) Firm 6 Firm 2 Firm 7 Firm 3 Firm 8 Firm 4
Top 4 firm moves down Second 4 firm moves up Hazard: Firm interactions -0.006 (0.021) -0.033*** (0.004) -0.035*** (0.004) 0.090*** (0.022) 0.039*** (0.003) 0.032*** (0.003) -0.001 (0.004) -0.002 (0.004) -0.011*** (0.004) -0.014*** (0.004) -0.014*** (0.004) -0.004 (0.004) -0.005 (0.005) -0.006 (0.004) Subject firm Productivity Net PPE Firm 1 Intangibles Tangible Capital Firm 5 0.004 (0.003) 0.001 (0.002) -0.001 (0.003) -0.002 (0.002) Firm 6 Firm 2 Firm 7 Firm 3 Firm 8 Firm 4 Intangible Capital Firm 5 Firm 1 -0.001 (0.002) 0.003 (0.003) 0.002 (0.003) 0.004 (0.003) Firm 6 Firm 2 Firm 7 Firm 3 Firm 8 Firm 4
Two sides of investment Two sides of investment Boosts firm output Diminishes displacement for firms #3 and #4 Externality Dominant firm investments suppress leapfrogging Sutton endogenous sunk cost model
Subject firm Productivity Net PPE 1 0.0885*** (0.0085) 0.0400*** (0.0041) 0.0024 (0.0017) 0.0263*** (0.0048) 0.0030** (0.0012) Decomposing Intangibles R&D Org. capital Other intangibles Top 4 firms (average) PPE, firm #3 -0.0173*** (0.0037) -0.0214*** (0.0037) -0.0042 (0.0027) -0.0174** (0.0078) 0.0011 (0.0015) PPE, firm #4 R&D Org. capital Other intangibles
2 0.085*** (0.023) 0.053*** (0.004) 0.003 (0.004) 0.009 (0.006) 0.006** (0.003) 3 0.056*** (0.017) 0.051*** (0.004) 0.008 (0.005) -0.001 (0.004) -0.013*** (0.004) -0.014** (0.006) 9140 0.106 Subject firm Productivity Net PPE Decomposing Intangibles Software Stock Acquisitions Advertising Top 4 firms (average) PPE, firm #3 -0.003 (0.006) -0.012*** (0.004) -0.014** (0.007) 0.002 (0.007) 0.003* (0.002) 7706 0.118 PPE, firm #4 Software Stock Acquisitions Advertising Observations R-squared
Magnitude of effect ??? ???= -.014 x 2
Industry level analysis Industry level analysis Own account software vs pre-packaged, contracted BEA data own account software Instrumental variable estimates EU KLEMS software for EU nations
III. Markups & Concentration III. Markups & Concentration
Markups Markups High markup industries high displacement Leading firms temporarily earn rents, but are more likely to be displaced
Conclusion Conclusion Schumpeterian competition declined since ~2000 Associated with shift to intangibles / proprietary software Relationship strengthened after 2000 Investment shifted after 2000 Especially own-account software Markups associated with higher dynamism Industry concentration with less
Conclusion: main idea Conclusion: main idea Technology playing a new role Tech disruption
Conclusion: main idea Conclusion: main idea Technology playing a new role Tech disruption Tech suppresses disruption
