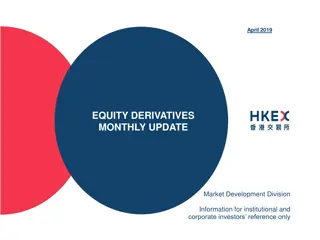
Equity Derivatives Monthly Update - October 2020
Monthly update on Equity Derivatives for institutional and corporate investors in October 2020. Provides information on equity indices performance, sector indices vs. HSI/HSCEI, and Equity Index Futures & Options for Hang Seng Index (HSI). Disclaimer included regarding the general informational nature of the document.
Download Presentation

Please find below an Image/Link to download the presentation.
The content on the website is provided AS IS for your information and personal use only. It may not be sold, licensed, or shared on other websites without obtaining consent from the author.If you encounter any issues during the download, it is possible that the publisher has removed the file from their server.
You are allowed to download the files provided on this website for personal or commercial use, subject to the condition that they are used lawfully. All files are the property of their respective owners.
The content on the website is provided AS IS for your information and personal use only. It may not be sold, licensed, or shared on other websites without obtaining consent from the author.
E N D
Presentation Transcript
Equity Derivatives Monthly Update Markets Division Information for institutional and corporate investors reference only October 2020
Disclaimer The information contained in this document is for general informational purposes only and does not constitute an offer, solicitation, invitation or recommendation to buy or sell any futures contracts or other products or to provide any investment advice or service of any kind. This document is not directed at, and is not intended for distribution to or use by, any person or entity in any jurisdiction or country where such distribution or use would be contrary to law or regulation or which would subject Hong Kong Exchanges and Clearing Limited ( HKEX ), Hong Kong Futures Exchange Limited ( HKFE ) (together, the Entities , each an Entity ), or any of their affiliates, or any of the companies that they operate, to any registration requirement within such jurisdiction or country. HKEX Pulse No section or clause in this document may be regarded as creating any obligation on the part of any of the Entities. Rights and obligations with regard to the trading, clearing and settlement of any futures contracts effected on HKFE shall depend solely on the applicable rules of HKFE and the relevant clearing house, as well as the applicable laws, rules and regulations of Hong Kong. Futures and Options Information Application Although the information contained in this document is obtained or compiled from sources believed to be reliable, neither of the Entities guarantees the accuracy, validity, timeliness or completeness of the information or data for any particular purpose, and the Entities and the companies that they operate shall not accept any responsibility for, or be liable for, errors, omissions or other inaccuracies in the information or for the consequences thereof. The information set out in this document is provided on an as is and as available basis and may be amended or changed. It is not a substitute for professional advice which takes account of your specific circumstances and nothing in this document constitutes legal advice. Neither of the Entities shall be responsible or liable for any loss or damage, directly or indirectly, arising from the use of or reliance upon any information provided in this document. Apple Store Google Play Additional disclaimer for CES China 120 Index Futures CES China 120 Index ( CES 120 Index ) are calculated and / or disseminated by China Securities Index Company Limited ( CSIC ) on behalf of China Exchanges Services Company Limited ( CESC ). Neither CESC nor CSIC guarantee (expressly or impliedly) the accuracy, completeness, timeliness or fitness for a particular purpose of the CESC Index and/or the information contained therein; nor do they accept any liability for any damages, loss, costs or expenses suffered by any person arising from the use of the CESC Index and/or the information contained therein. Xiaomi 360
October 2020 Equity Indices Monthly Performance in Sector Indices vs HSI / HSCEI CES120 vs China Theme Indices Index Name Index Name HS Mainland Banks Index +7.3% CES120 Index +4.2% HSCEI +3.9% HSCEI +3.9% HSI +2.8% FTSE A50 Index +3.4% HS Mainland Oil & Gas Index -5.2% CSI 300 Index +2.4% HS Mainland Properties Index -5.7% % Change % Change Equity Index Futures Access Codes HS Mainland Properties HS Mainland Oil & Gas HS Mainland Banks CES 120 HSI HSCEI Vendor Bloomberg BMWA PPTA OGIA CESA HIA HCA Refinitiv 0#HMBI: 0#HMPI: 0#HMOI: 0#HCHH: 0#HSI: 0#HCEI: WIND MBIF MPIF MOIF CHHF HSIF HHIF ET Net MBI MPI MOI CHH HSI HHI Data Source: Bloomberg As at 30 October 2020 Information for reference only 3
Equity Index Futures & Options Hang Seng Index (HSI) Futures & Options HSI Futures (YoY) HSI Options (YoY) HSI Products (2019 vs 2018) ADV OI* Average Daily Volume Open Interest Open Interest Average Daily Volume (No. of Contracts) (No. of Contracts) (No. of Contracts) (No. of Contracts) 280,000 200,000 60,000 400,000 ADV (L-Axis) Open Interest (R-Axis) ADV (L-Axis) Open Interest (R-Axis) 240,000 215,625 (-8%) 143,302 (+7%) HSI Futures 150,000 45,000 300,000 200,000 160,000 100,000 30,000 200,000 120,000 92,793 (-7%) 12,334 (-2%) Mini-HSI Futures 80,000 50,000 15,000 100,000 40,000 0 0 0 0 51,753 (+0%) 309,382 (+11%) HSI Options HSI Futures (MoM) HSI Options (MoM) 13,549 (+35%) 20,616 (+10%) Mini-HSI Options Open Interest Open Interest (No. of Contracts) Average Daily Volume Average Daily Volume (No. of Contracts) (No. of Contracts) (No. of Contracts) ADV (L-Axis) Open Interest (R-Axis) 300,000 200,000 90,000 600,000 ADV (L-Axis) Open Interest (R-Axis) 250,000 75,000 150,000 HSI Volatility Index Futures 200,000 60,000 400,000 0.7 (+17420%) 1 (-) 150,000 100,000 45,000 100,000 30,000 200,000 HSI Dividend Point Index Futures 50,000 50,000 15,000 61 (+17%) 4,879 (+164%) 0 0 0 0 Dec Nov Dec Nov Oct Oct May May Mar Mar Sep Aug Sep Aug Apr Apr Jan Jun Jan Jun Jul Jul Feb Feb 2018 2019 2018 2019 Data Source: HKEX * OI compared to previous year-end Information for reference only As at 30 October 2020 4
Equity Index Futures & Options HSI Futures & Options Hang Seng Index HSI vs VHSI Price Level HSI & Top 5 Constituents Includes the largest and most liquid stocks listed in Hong Kong ('000) Index Description 130 26 28 HSI VHSI HSI Index HSBC CCB Tencent AIA China Mobile 24,107.42 (As at 30 Oct 2020) Index Level 120 26 21.7 Index Volatility (30-Day Historical) 25 110 24 263.80 (Oct 2020) Index Avg. Day High-Low Range 100 22 0.97 HSCEI Correlation (2020) 24 90 20 Hang Seng Index Futures 80 Aug-20 23 Aug-20 18 Sep-20 Oct-20 Sep-20 Oct-20 HK$50 Contract Multiplier Distribution of HSI Index Options OI in Month-end HK$1.21Mn (As at 30 Oct 2020) Notional Value (1 Contract) Put Call Transaction Cost* 39.0 39.0 35.6 Index Strike Price ('000) 35.6 33.4 Index Strike Price ('000) N/A Stamp Duty 33.4 31.4 31.4 29.4 HK$10 / contract Trading Fee 29.4 27.4 27.4 25.4 25.4 HK$0.54 / contract SFC Levy 23.4 23.4 21.4 21.4 Negotiable Commission Rate 19.7 19.7 18.7 18.7 17.7 HK$98,800 Margin as of 02 Jul 2020 17.7 10.0 10.0 0 4 Open Interest ('000) 8 12 16 0 2 Open Interest ('000) 4 6 8 10 Data Source: HKEX, Bloomberg * All calculations are in HKD and exclude commission fees Information for reference only As at 30 October 2020 5
Equity Index Futures & Options Hang Seng China Enterprises Index (HSCEI) Futures & Options HSCEI Options (YoY) HSCEI Futures (YoY) HSCEI Products (2020 vs 2019) ADV OI* Average Daily Volume Open Interest Open Interest Average Daily Volume (No. of Contracts) (No. of Contracts) (No. of Contracts) (No. of Contracts) 160,000 600,000 120,000 2,800,000 ADV (L-Axis) Open Interest (R-Axis) ADV (L-Axis) Open Interest (R-Axis) 2,400,000 500,000 100,000 150,140 (+8%) 356,368 (+9%) HSCEI Futures 120,000 2,000,000 400,000 80,000 1,600,000 80,000 300,000 60,000 1,200,000 Mini HSCEI Futures 200,000 40,000 19,411 (+30%) 5,833 (+38%) 800,000 40,000 100,000 20,000 400,000 0 0 0 0 86,307 (-2%) 2,333,415 (+12%) HSCEI Options HSCEI Futures (MoM) HSCEI Options (MoM) Average Daily Volume Open Interest (No. of Contracts) Average Daily Volume Open Interest (No. of Contracts) Mini HSCEI Options (No. of Contracts) 2,335 (-1%) 10,329 (-19%) (No. of Contracts) 150,000 4,000,000 240,000 600,000 ADV (L-Axis) Open Interest (R-Axis) ADV (L-Axis) Open Interest (R-Axis) 500,000 HSCEI Dividend Point Index Futures 180,000 3,000,000 400,000 100,000 1,847 (-14%) 122,316 (+5%) 120,000 300,000 2,000,000 200,000 50,000 60,000 1,000,000 100,000 0 0 0 0 Nov Dec Oct May Mar Aug Sep Apr Jan Jun Jul Feb Nov Dec Oct May Mar Aug Sep Apr Jan Jun Jul Feb 2019 2020 2019 2020 Data Source: HKEX * OI compared to previous year-end Information for reference only As at 30 October 2020 6
Equity Index Futures & Options HSCEI Futures & Options HSCEI HSI vs HSCEI HSCEI & Top 5 Constituents Comprises the largest and most liquid H shares Index Description 109 120 HSI HSCEI HSCEI ICBC BOC Ping An CCB China Life 9,760.24 (As at 30 Oct 2020) Index Level 107 110 21.9 Index Volatility (30-Day Historical) 105 116.71 (Oct 2020) Index Avg. Day High-Low Range 100 103 Correlation with HSI, CES120 (2020) 0.97,0.9 90 101 Correlation with CSI300, FTSE A50 (2020) 0.787,0.823 99 80 Aug-20 Sep-20 Oct-20 05-Oct 18-Oct HSCEI Futures Distribution of HSCEI Index Options OI in Month-end HK$50 Contract Multiplier HK$0.49Mn (As at 30 Oct 2020) Notional Value (1 Contract) Call Put 17.0 17.0 15.0 15.0 Index Strike Price ('000) 13.4 13.4 Index Strike Price ('000) 12.4 Transaction Cost* 12.4 11.4 11.4 10.4 N/A Stamp Duty 10.4 9.4 9.4 8.4 HK$3.5 / contract Trading Fee 8.4 7.4 7.4 6.0 HK$0.54 / contract SFC Levy 6.0 4.0 4.0 2.0 Negotiable Commission Rate 2.0 0 60 120 180 0 20 Open Interest ('000) 40 60 80 100 Open Interest ('000) HK$39,000 Margin as of 02 Jul 2020 Data Source: HKEX, Bloomberg * All calculations are in HKD and exclude commission fees Information for reference only As at 30 October 2020 7
Weekly HSI & HSCEI Options Performance Weekly HSI Options Weekly HSI & HSCEI Options Volume Volume (No. of Contracts) HK$50 Contract Multiplier Akuna, Eclipse, I-Access, IMC, Optiver Liquidity Providers 12,000 Weekly HSI Options Weekly HSCEI Options 9,000 Transaction Cost* 6,000 N/A Stamp Duty HK$10 / contract Trading Fee 3,000 HK$0.54 / contract SFC Levy 0 05/10 06/10 07/10 09/10 13/10 14/10 15/10 16/10 19/10 20/10 21/10 22/10 27/10 28/10 29/10 30/10 08/10 12/10 23/10 Negotiable Commission Rate Weekly HSCEI Options Volume (No. of Contracts) HK$50 Contract Multiplier 8,000 Weekly HSI & HSCEI Options Call Weekly HSI & HSCEI Options Put Akuna, Eclipse, I-Access, IMC, Optiver Liquidity Providers 6,000 Transaction Cost* 4,000 N/A Stamp Duty 2,000 HK$3.5 / contract Trading Fee 0 HK$0.54 / contract SFC Levy 5/10 7/10 8/10 6/10 9/10 12/10 13/10 14/10 15/10 16/10 19/10 21/10 22/10 27/10 28/10 29/10 30/10 20/10 23/10 Negotiable Commission Rate An investment tool to manage short term event risk Data Source: HKEX * All calculations are in HKD and exclude commission fees Information for reference only As at 30 October 2020 8
Equity Futures & Options Single Stock Futures & Options No. of Single Stock Derivatives Single Stock Derivatives ADV (2020 vs 2019) ADV OI* Single Stock Futures Single Stock Options 81 101 Stock Futures 4,455 (+19%) 17,861 (-35%) Stock Options 518,556 (+17%) 9,418,677 (+41%) Stock Futures (YoY) Latest and Future Developments Stock Options (YoY) Open Interest Average Daily Volume Average Daily Volume Open Interest (No. of Contracts) (No. of Contracts) (No. of Contracts) (No. of Contracts) 5,000 30,000 600,000 10,000,000 Stock Futures ADV (L-Axis) Open Interest (R-Axis) ADV (L-Axis) Open Interest (R-Axis) 25,000 4,000 8,000,000 Products 3 A-shares ETFs futures contracts Total 81 stock futures contracts 400,000 20,000 6,000,000 3,000 15,000 4,000,000 2,000 200,000 10,000 2,000,000 1,000 5,000 0 0 0 0 Stock Options Stock Options (MoM) Stock Futures (MoM) Products 3 A-shares ETFs options contracts Total 101 stock options contracts Average Daily Volume Open Interest (No. of Contracts) Average Daily Volume Open Interest (No. of Contracts) (No. of Contracts) (No. of Contracts) ADV (L-Axis) Open Interest (R-Axis) ADV (L-Axis) Open Interest (R-Axis) 800,000 12,000,000 8,000 30,000 25,000 600,000 6,000 Market Makers (MMs) 3 types of market makers (PMM/ CQMM/ QRMM) CQMM to provide 50 series continuous quotations 8,000,000 20,000 400,000 4,000 15,000 4,000,000 10,000 200,000 2,000 5,000 0 0 0 0 Nov Dec Oct May Mar Aug Sep Apr Jan Jun Jul Feb Dec Nov Oct May Mar Sep Aug Apr Jun Jan Jul Feb 2019 2020 2019 2020 Data Source: HKEX * OI compared to previous year-end Information for reference only As at 30 October 2020 9
MSCI Asia and Emerging Market Index Futures Performance Open Interest (30 October 2020) MSCI Asia and Emerging Market Index representation 38 DM and EM countries and regional indices Open Interest Index Description (No. of Contracts) 100,000 80,000 MSCI Asia and Emerging Market Index Futures 60,000 Average US$40 Contract Multiplier 40,000 Average US$41K (As at 30 October 2020) Notional Value (1 Contract) 20,000 ANTZ, Chief, Eclipse, Flow, HNK, HRTC, Huaxin, Jump, LED, Legend Arb, Mercury, President, Virtu, Yuanta 0 Liquidity Providers Jul Oct Aug Sep Average Daily Volume (30 October 2020) Transaction Cost* N/A Stamp Duty ADV (No. of Contracts) US$0.6-US$1.0 / contract Trading Fee 10,000 US$0.07 / contract SFC Levy 8,000 6,000 4,000 2,000 0 Jul Oct Aug Sep Volume and Open Interest continue to growth Futures contracts have relatively lower transaction costs Data Source: HKEX * Exclude commission fees Information for reference only As at 30 October 2020 10
MSCI AC Asia ex Japan NTR Index (AxJ) Futures Performance MSCI AxJ Open Interest (30 October 2020) representation 2 DM countries (excl. Japan) and 9 EM countries in Asia Open Interest Index Description (No. of Contracts) 25,000 551.99 (As at 30 October 2020) Index Level 20,000 Index Volatility (30-Day Historical) 20.6 15,000 4.03 (October 2020) Index Avg. Day High-Low Range 10,000 0.929 HSI Correlation (2020) 5,000 0.928 HSCEI Correlation (2020) 0 Mar May Feb Jul Oct Nov Dec Jan Jun Apr Sep Aug MSCI AxJ Futures 2019 2020 US$100 Contract Multiplier US$55K (As at 30 October 2020) Notional Value (1 Contract) MSCI AxJ Combines Developed and Emerging Markets (Rebased to 100) US$0.28Mn (5 Contracts) Avg. Quote Size MSCI AxJ MSCI SG MSCI Korea MSCI Philippines MSCI China MSCI India MSCI Malaysia MSCI Taiwan MSCI HK MSCI Indonesia MSCI Pakistan MSCI Thailand 0.9 index points (October 2020) Avg. Bid-Ask Trading Spread 130 Flow and 11 banks Liquidity Providers 120 110 Transaction Cost* 100 N/A Stamp Duty US$0.5 / contract Trading Fee 90 US$0.07 / contract SFC Levy 80 Aug-2020 US$2,640 Margin as of 02 Jul 2020 Sep-2020 Oct-2020 MSCI AxJ is a well-established benchmark representing Asia regional (excluding Japan) equity market performance Futures contracts have relatively lower transaction costs Data Source: HKEX * All calculations are in USD and exclude commission fees Information for reference only As at 30 October 2020 11
Hang Seng Mainland Banks Index Futures Performance Hang Seng Mainland Banks Index (HSMBI) 5-Min Avg. Bid-Ask Spreads (30 October 2020) 10 largest and most representative HKEX-listed mainland banks stocks Index Description HSMBI Futures 2.35% CEB Bank 6818.HK 0.58% 2,407.26 (As at 30 October 2020) Index Level Bank of China 3988.HK 0.57% Index Volatility (30-Day Historical) 21.9 Minsheng Bank 1988.HK 0.51% CITIC Bank 998.HK 0.45% 38.21 (October 2020) Index Avg. Day High-Low Range PSBC 1658.HK 0.43% 0.818 HSI Correlation (2020) ABC 1288.HK 0.42% CM Bank 3968.HK 0.32% 0.87 HSCEI Correlation (2020) Bankcomm 3328.HK 0.28% ICBC 1398.HK 0.25% Hang Seng Mainland Banks Index Futures CCB 939.HK 0.19% HK$50 Contract Multiplier HK$0.12Mn (As at 30 October 2020) Notional Value (1 Contract) Index & Constituents 3-Month Performance (Rebased to 100) HK$0.60Mn (5 Contracts) Avg. Quote Size HSMBI ICBC (1398.HK) ABC (1288.HK) CCB (939.HK) BOC (3988.HK) 66.2 index points (October 2020) Avg. Bid-Ask Trading Spread 115 N/A Liquidity Providers 110 105 100 Transaction Cost* 95 N/A Stamp Duty 90 HK$2 / contract Trading Fee 85 HK$0.54 / contract SFC Levy 80 Aug-2020 HK$6,740 Margin as of 02 Jul 2020 Sep-2020 Oct-2020 HSMBI Futures can be used for hedging Futures contracts have relatively lower transaction costs Data Source: HKEX, HSIL, Bloomberg * All calculations are in HKD and exclude commission fees Information for reference only As at 30 October 2020 12
Hang Seng Mainland Oil & Gas Index Futures Performance 5-Min Avg. Bid-Ask Spreads (30 October 2020) Hang Seng Mainland Oil & Gas Index (HSMOGI) 7 largest and most representative HKEX-listed mainland oil & gas stocks Index Description HSMOGI Futures 13.89% 0,879.78 (As at 30 October 2020) Index Level BG Blue Sky 6828.HK 1.16% Index Volatility (30-Day Historical) 33.9 PetroChina 857.HK 0.59% 11.77 (October 2020) Index Avg. Day High-Low Range Kunlun Energy 135.HK 0.43% 0.764 HSI Correlation (2020) Sinopec Corp 386.HK 0.41% 0.777 HSCEI Correlation (2020) CNOOC 883.HK 0.31% China Oilfield 2883.HK 0.22% Hang Seng Mainland Oil & Gas Index Futures HK$50 Contract Multiplier HK$44K (As at 30 October 2020) Notional Value (1 Contract) Index & Constituents 3-Month Performance (Rebased to 100) HK$0.22Mn (5 Contracts) Avg. Quote Size 99.7 index points (October 2020) Avg. Bid-Ask Trading Spread 130 HSMOGI CNOOC (883.HK) Kunlun Energy (135.HK) PetroChina (857.HK) Sinopec Corp (386.HK) N/A Liquidity Providers 120 110 Transaction Cost* 100 N/A Stamp Duty 90 HK$2 / contract Trading Fee 80 HK$0.54 / contract SFC Levy 70 Aug-2020 HK$5,380 Margin as of 02 Jul 2020 Sep-2020 Oct-2020 Futures contracts have relatively lower transaction costs HSMOGI Futures can be used for hedging Data Source: HKEX, HSIL, Bloomberg * All calculations are in HKD and exclude commission fees Information for reference only As at 30 October 2020 13
Hang Seng Mainland Properties Index Futures Performance Hang Seng Mainland Properties Index (HSMPI) 5-Min Avg. Bid-Ask Spreads (30 October 2020) 10 largest and most representative HKEX-listed mainland properties stocks Index Description HSMPI Futures 1.59% Fullshare 607.HK 1.33% 6,010.33 (As at 30 October 2020) Index Level Sino-Ocean Gp 3377.HK 0.69% Index Volatility (30-Day Historical) 31.2 Shimao Property 813.HK 0.48% China Vanke 2202.HK 0.44% 77.89 (October 2020) Index Avg. Day High-Low Range China Res Land 1109.HK 0.36% 0.839 HSI Correlation (2020) Kerry Ppt 683.HK 0.28% 0.866 HSCEI Correlation (2020) Country Garden 2007.HK 0.28% China Overseas 688.HK 0.22% Longfor PPT 960.HK 0.19% Hang Seng Mainland Properties Index Futures Evergrande 3333.HK 0.16% HK$50 Contract Multiplier HK$0.30Mn (As at 30 October 2020) Notional Value (1 Contract) Index & Constituents 3-Month Performance (Rebased to 100) HK$1.5Mn (5 Contracts) Avg. Quote Size HSMPI China Overseas (688.HK) China Res Land (1109.HK) Evergrande (3333.HK) Country Garden (2007.HK) 112.6 index points (October 2020) Avg. Bid-Ask Trading Spread 140 N/A Liquidity Providers 120 Transaction Cost* 100 N/A Stamp Duty HK$2 / contract Trading Fee 80 HK$0.54 / contract SFC Levy 60 Aug-2020 HK$24,260 Margin as of 02 Jul 2020 Sep-2020 Oct-2020 Futures contracts have relatively lower transaction costs HSMPI Futures can be used for hedging Data Source: HKEX, HSIL, Bloomberg * All calculations are in HKD and exclude commission fees Information for reference only As at 30 October 2020 14
CES120 Index Futures Performance CES120 Index 5-Min Avg. Bid-Ask Spreads (30 October 2020) 80 A-Shares and 40 HK-listed Mainland China H-shares, P-chips, and red chips Index Description CSOP FTSE A50 ETF (2822.HK) 0.13% 7,788.49 (As at 30 October 2020) Index Level Index Volatility (30-Day Historical) 18.8 ChinaAMC CSI300 ETF (3188.HK) 0.12% 77.59 (October 2020) Index Avg. Day High-Low Range 0.923 CSI300 Correlation (2020) CES120 Futures 0.10% 0.941 FTSE A50 Correlation (2020) X iShares A50 ETF (2823.HK) 0.07% CES120 Index Futures HK$50 Contract Multiplier CES120 Futures have relatively tighter Bid-Ask Spreads HK$0.39Mn (As at 30 October 2020) Notional Value (1 Contract) CES120 & Top Constituents 3-Month Performance (Rebased to 100) HK$1.95Mn (5 Contracts) Average Quote Size Average Bid-Ask Trading Spread 7.9 index points (October 2020) 120 CES120 Index CCB China Mobile Tencent Ping An Flow Liquidity Providers 110 100 Transaction Cost* N/A Stamp Duty 90 HK$5 / contract Trading Fee 80 HK$0.54 / contract SFC Levy 70 Aug-2020 HK$17,510 Margin as of 02 Jul 2020 Sep-2020 Oct-2020 Futures contracts have relatively lower transaction costs CES120 Futures can be used to hedge A-share positions Data Source: HKEX, HSIL, Bloomberg * All calculations are in HKD and exclude commission fees Information for reference only As at 30 October 2020 15
MSCI Asia and Emerging Market Index Futures Access Codes MSCI China Free NTR (USD) Index Futures HJEA Index 0#HMCN: MCNF.HK MSCI EM Asia ex China NTR (USD) Index Futures HQOA Index 0#HMAC: MSCI EM Asia ex Korea NTR (USD) Index Futures HQRA Index 0#HMAK: MSCI EM EMEA NTR (USD) Index Futures HQTA Index 0#HMEE: MSCI EM ex China NTR (USD) Index Futures HQDA Index 0#HMXC: MSCI EM ex Korea NTR (USD) Index Futures HQIA Index 0#HMXK: MSCI EM LatAm NTR (USD) Index Futures HQYA Index 0#HMEL: MSCI Australia NTR (USD) Index Futures HKCA Index 0#HMAN: MANF.HK MSCI China Free (USD) Index Futures HMSA Index 0#HMCU: MSCI EM Asia NTR (USD) Index Futures HRSA Index 0#HEAN: EANF.HK Information Vendor Bloomberg Refinitiv WIND MSCI Emerging Markets NTR (USD) Index Futures HMOA Index 0#HEMN: MSCI Emerging Markets (USD) Index Futures HMPA Index 0#HMEM: MSCI Hong Kong NTR (USD) Index Futures HLCA Index 0#HMHN: MSCI Indonesia Index (USD) Futures HMLA Index 0#HMID: MSCI Indonesia NTR (USD) Index Futures HKBA Index 0#HMDN: MDNF.HK MSCI India (USD) Index Futures HRTA Index 0#HMDA: MSCI India NTR (USD) Index Futures HJDA Index 0#HMIN: MINF.HK MSCI Japan (JPY) Index Futures HQAA Index 0#HMJP: MSCI Japan NTR (JPY) Index Futures HQBA Index 0#HMJJ: MSCI Japan NTR (USD) Index Futures HJCA Index 0#HMJU: MJUF.HK Information Vendor Bloomberg Refinitiv WIND MSCI Singapore Free NTR (USD) Index Futures HOBA Index 0#HMGN: MSCI New Zealand NTR (USD) Index Futures HOPA Index 0#HMNZ: MSCI Pacific ex Japan NTR (USD) Index Futures HRPA Index 0#HMPJ: MSCI Philippines (USD) Index Futures HNSA Index 0#HMPH: MSCI Philippines NTR (USD) Index Futures HLEA Index 0#HMPN: MSCI Singapore Free (SGD) Index Futures HKOA Index 0#HMSG: MSCI Singapore NTR (USD) Index Futures HKPA Index 0#HMSN: MSCI Malaysia (USD) Index Futures HMYA Index 0#HMMY: MSCI Malaysia NTR (USD) Index Futures HKEA Index 0#HMMN: MMNF.HK MSCI Pacific NTR (USD) Index Futures HRBA Index 0#HMPC: Information Vendor Bloomberg Refinitiv WIND MSCI Taiwan 25/50 NTR (USD) Index Futures HRDA Index 0#HTWN: MSCI Taiwan (USD) Index Futures HJAA Index 0#HMTW: MTWF.HK MSCI Taiwan 25/50 (USD) Index Futures HRCA Index 0#HTWP: MSCI Taiwan NTR (USD) Index Futures HJBA Index 0#HMWN: MWNF.HK MSCI Thailand (USD) Index Futures HMTA Index 0#HMTH: MSCI Thailand NTR (USD) Index Futures HKDA Index 0#HMTN: MTNF.HK MSCI Vietnam (USD) Index Futures HNTA Index 0#HMVT: MSCI Vietnam NTR (USD) Index Futures HKSA Index 0#HMVN: Information Vendor Bloomberg Refinitiv WIND Data Source: HKEX 16
Weekly HSI and HSCEI Options Access Codes Hong Kong and International Information Vendors Information Vendor AASTOCKS Bloomberg DB Power ET Net Limited Infocast MegaHub Limited N2N-AFE Refinitiv Tele-Trend Weekly HSI Options 322105 HSI Index OMON HSI Weekly HSCEI Options 322125 HSCEI Index OMON HHI Menu "Futures/Options" > "Futures/Options Quotation (Short-term) > Access code: The series name HSI HSI 873101 <0#HSIW*.HF> File->Open->Options->HSI HHI HHI 873121 <0#HCEIW*.HF> File->Open->Options->HHI MSCI AxJ and MSCI AxJ Futures Access Codes Hong Kong and International Information Vendors Information Vendor AASTOCKS Activ Financial Bloomberg CQG DB Power East Money Information Factset ICE Data Services Infocast N2N-AFE QPWeb SIX Financial Information Refinitiv Telequote Data Tele-Trend MSCI AxJ Index - - M1ASJ Index - - - - - - - - - .MIAX00000NUS - - MSCI AxJ Index Futures 221495 MXJ/<yy><m>.HF MJSA Index CT MXJ MXJ MXJ MXJE F:MXJ MXJ 870823 P11203 MXJmy 0#HMXJ: MXJ/<yy><m>.HF MXJFC, MXJmyy Data Source: HKEX 17
Sector Index and Sector Index Futures Access Codes Hong Kong and International Information Vendors Information Vendor Mainland Banks Index Mainland Banks Index Futures Mainland Properties Index Mainland Properties Index Futures Mainland Oil & Gas Index Mainland Oil & Gas Index Futures AASTOCKS 221420 221425 221415 Activ Financial MBI/16K.HF MPI/16K.HF MOI/16K.HF =0200700.HK =0200800.HK =0201000.HK AFE 870809 870810 870808 837451 837451 837451 Bloomberg BMWA Index PPTA Index OGIA Index HSMBI Index MSMPI Index HSMOGI Index DB Power ET Net Infocast MBI MBI MBI MPI MPI MPI MOI MOI MOI MBN HSMBI MPR MSMPI MOG MOGI SEHK.HHSMO GI QuotePower P11223 P11224 P11222 SEHK.HHSMBI SEHK.HHSMPI Telequote Refinitiv MBImy 0#HMBI: MPImy 0#HMPI: MOImy 0#HMOI: .HSMBI .HSMPI .HSMOGI Mainland Information Vendors Information Vendor Mainland Banks Index Mainland Banks Index Futures Mainland Properties Index Mainland Properties Index Futures Mainland Oil & Gas Index Mainland Oil & Gas Index Futures East Money MBI MPI MOI HSMBI HSMPI HSMOGI Hexin Flush Financial MBIC MPIC MOIC MBI+Month+Ye ar 209 MBIF+yymm+H K MOI+Month+Ye ar 209 MOIF+yymm+H K Pobo Financial MPI+Month+Year Qianlong 209 999905 999902 999903 Wind MPIF+yymm+HK HSMBI HSMPI HSMOGI Data Source: HKEX 18
CES120 Index and CES120 Index Futures Access Codes Hong Kong and International Information Vendors Information Vendor CES 120 Index CES 120 Index Futures Bloomberg Finance L.P. Refinitiv AAStocks.com Limited AFE Solutions Ltd. DB Power Online Limited ET Net Limited Infocast Limited Interactive Data Group Marketprizm Hong Kong Limited SIX Financial Information Ltd. Telequote Data International Limited CES120 .HKCES120 110056 837505 CES120 CEC CE120 I:CES120 CES120 CES120 CES120 CESA Index DES <GO> 0#HCHH: 221360 870800 CHH CHH CHH Fn:CHH\MYYDD CHHmy CHHmy CHHmy Mainland Information Vendors Information Vendor Hithink RoyalFlush Information Network Ltd Shangahai DZH Limited Shanghai Gildata Services Co Ltd Shanghai Wind Information Co., Ltd Zheng Zhou Esunny Information Technology Co, Ltd. Shanghai Wenhua Financial Information Ltd Shanghai Qianlong Advanced Technology Co Ltd CES 120 Index CES 120 Index Futures CES120 CES120 CES120 CES120 CHHC CHH+Month Code+Year Code - CHHF+yymm+.HK - CHH - CHHmy Page 209 CES120 Data Source: HKEX 19
 undefined


