Engineering Approach to Enhancing Water Availability in the Mediterranean Basin
Explore an innovative engineering approach to addressing water scarcity in the Mediterranean Basin through regreening degraded areas using sea water evaporation technology. This presentation discusses the impact on convective triggering, surface evaporation, and technology development for sustainable water cycle restoration.
Uploaded on Nov 21, 2024 | 2 Views
Download Presentation

Please find below an Image/Link to download the presentation.
The content on the website is provided AS IS for your information and personal use only. It may not be sold, licensed, or shared on other websites without obtaining consent from the author.If you encounter any issues during the download, it is possible that the publisher has removed the file from their server.
You are allowed to download the files provided on this website for personal or commercial use, subject to the condition that they are used lawfully. All files are the property of their respective owners.
The content on the website is provided AS IS for your information and personal use only. It may not be sold, licensed, or shared on other websites without obtaining consent from the author.
E N D
Presentation Transcript
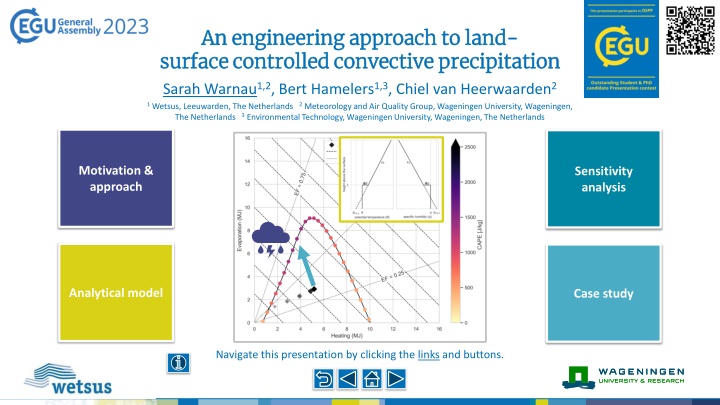
An engineering approach to land An engineering approach to land- - surface surface controlled controlled convective convective precipitation Sarah Warnau1,2, Bert Hamelers1,3, Chiel van Heerwaarden2 precipitation 1Wetsus, Leeuwarden, The Netherlands 2Meteorology and Air Quality Group, Wageningen University, Wageningen, The Netherlands 3Environmental Technology, Wageningen University, Wageningen, The Netherlands Motivation approach Sensitivity analysis Motivation & approach Sensitivity analysis Analytical model Case study Analytical model Case study Navigate this presentation by clicking the links and buttons.
Motivation approach Analytical model Sensitivity analysis Case study Motivation & approach Analytical model Sensitivity analysis Case study Motivation Motivation Water scarcity is a challenge in many arid and semi-arid regions in the Mediterranean Basin (Douville et al. 2021) Reduced agricultural productivity Negative impacts on public health Climate change will lead to more drying (Douville et al. 2021; Miralles et al. 2019) Precipitation reduction Increase in evaporative demand Climate mitigation and adaptation strategies are needed Observed trends in temperature (top, C decade-1) and rainfall (mm-1 decade-1) in the Mediterranean Basin over land for the period 1950-2018, from Cramer et al. (2022). approach approach
Motivation approach Analytical model Sensitivity analysis Case study Motivation & approach Analytical model Sensitivity analysis Case study Approach Approach New approach to sustainably restore local water cycles for more water availability in the Mediterranean Basin. How? Regreening degraded areas using a sea water evaporation technology to provide an extra source of moisture at the start of the project. First step: How can the technology, through surface flux partitioning, affect convective triggering? model model
Motivation approach Analytical model Sensitivity analysis Case study Motivation & approach Analytical model Sensitivity analysis Case study Natural water Natural water cycle cycle restoration restoration Convective precipitation triggering Convective precipitation triggering + Surface evaporation + + + Technology Technology Regreening
Motivation approach Analytical model Sensitivity analysis Case study Motivation & approach Analytical model Sensitivity analysis Case study Sea water Sea water evaporation evaporation technology technology The technology uses direct evaporation driven by solar energy to produce water vapor from brackish or seawater. The technology is being developed at Wetsus.
Motivation approach Analytical model Sensitivity analysis Case study Motivation & approach Analytical model Sensitivity analysis Case study Convective Convective triggering triggering Similar to Yin et al. (2015) we use two conditions as proxies for deep convection initiation: 1) The crossing of the top of the convective boundary layer (ABL h) and the lifting condensation level (LCL). 2) CAPE exceeding 400 J/kg, a typical threshold for convective initiation in midlatitude continental regions.
Analytical model Motivation approach Sensitivity analysis Case study Motivation & approach Analytical model Sensitivity analysis Case study Slab model of Slab model of the the convective convective boundary boundary layer layer Equation for boundary layer growth ? ??= ?e= e ? where = ?? = + ??,0 Equations of conservation for potential temperature and specific humidity ?? ??= s e ?? ??= q s q Idealize profiles of potential temperature and specific humidity as used in the slab model of the convective boundary layer. FA denotes the free atmosphere and is the lapse rate. h is the ABL depth. e We make the closure assumption q e= ? q Slab model // Analytical solution // LCL-crossing // CAPE and CIN s
Analytical model Motivation approach Sensitivity analysis Case study Motivation & approach Analytical model Sensitivity analysis Case study Analytical Analytical solution of solution of the the slab model slab model Boundary layer growth 1 ? ? 0 2 2 + 4 2 ? + ? ? = 0 0 ?,0 ? ? ??? = 2 + 4 0 2 0 Potential temperature ? =1 ?0+ ? ? ??? + ???,0 +?? 2 2 Specific humidity ?0+ ? ? ??? + ???,0 + ? ? =1 2 2 ??= 0 ?0 ???,0 ? 2 0 Slab model // Analytical solution // LCL-crossing // CAPE and CIN
Analytical model Motivation approach Sensitivity analysis Case study Motivation & approach Analytical model Sensitivity analysis Case study Crossing of Crossing of the the ABL top and ABL top and the the LCL LCL For a certain ? ? ??? find the corresponding ? ? ??? that leads to ABL h = LCL Solve: ??? ( ? ? ??? ) = ???( ? ? ??? , ? ? ???) See also: convective triggering See also: convective triggering Time series of turbulent mass fluxes, shaded where the integrals under the curves lead to an ABL-LCL crossing Slab model // Analytical solution // LCL-crossing // CAPE and CIN
Analytical model Motivation approach Sensitivity analysis Case study Motivation & approach Analytical model Sensitivity analysis Case study CAPE and CIN CAPE and CIN We calculate CAPE and CIN at the moment of LCL crossing using the python library See also: convective triggering See also: convective triggering ?? CAPE = ?? ??????? ?????ln ? ??? ??? CIN = ?? ??????? ?????ln ? =??? Sensitivity analysis Sensitivity analysis Slab model // Analytical solution // LCL-crossing // CAPE and CIN
Sensitivity analysis Motivation approach Analytical model Case study Motivation & approach Analytical model Sensitivity analysis Case study Sensitivity stability Sensitivity Sensitivity analysis: analysis: temperature temperature Sensitivity stability Initial Relative Humidity at surface: 50%. Warmer: more evaporation for LCL crossing. Heating from the surface must be limited for high CAPE. Standard values How to interpret this type of figure? Initial conditions How to interpret this type of figure? Result Standard values
Sensitivity analysis Motivation approach Analytical model Case study Motivation & approach Analytical model Sensitivity analysis Case study Sensitivity Sensitivity analysis: analysis: stability stability Sensitivity temperature Sensitivity temperature Initial Relative Humidity at the surface is 50%. Lower stability of the free atmosphere: less need for moisture for LCL crossing and higher CAPE. CAPE is higher when heating is limited (N.B.: CAPE in left part of plot where the lines overlap is not shown). Standard values How to interpret this type of figure? Initial conditions How to interpret this type of figure? Result Standard values Case study Case study
Sensitivity analysis Motivation approach Analytical model Case study Motivation & approach Analytical model Sensitivity analysis Case study Standard Standard values values sensitivity sensitivity analysis analysis Parameter Value 500 m Description Initial ABL height 0 0 303 K Initial ABL potential temperature ?0 14.8 g/kg Initial ABL specific humidity ?0 1 K Initial potential temperature jump at ABL top q0 -0.5 g/kg Initial specific humidity jump at ABL top 302 K Surface intercept of the free atmospheric potential temperature Surface intercept of the free atmospheric specific humidity Free atmosphere potential temperature slope ???,? 13.8 g/kg ???,? ?? 6 K/km -1 g/kg/km Free atmosphere potential humidity slope ? Back to sensitivity analysis
Motivation approach Analytical model Case study Sensitivity analysis Motivation & approach Analytical model Sensitivity analysis Case study Annotated Annotated figure figure The solid line is the solution of the analytical model for the ABL-LCL crossing. Above the curve ABL > LCL, under the curve ABL < LCL. The colors of the dots indicate the corresponding CAPE values. Moving over a line of constant energy changes the partitioning of energy into sensible and latent heat. Moving over a line of constant evaporative fraction changes the amount of energy added to the system. Diamonds (only in case study figures) indicate the measured fluxes, integrated over time. Darker and larger = later in the day.
Case study Motivation approach Analytical model Sensitivity analysis Motivation & approach Analytical model Sensitivity analysis Case study Case Case study study: : Yatir When would convective triggering be possible with enhanced evaporation? Yatir Forest Forest, , Israel Israel LCL crossing achievable, high CAPE LCL crossing achievable, no CAPE LCL crossing achievable, high CAPE LCL crossing achievable, no CAPE Four examples of different situations About the site About the site How to interpret this type of figure? How to interpret this type of figure? Increasing the heat flux more effective Increasing the heat flux more effective Convective precipi-tation example Data Convective precipi- tation example Data
Case study Motivation approach Analytical model Sensitivity analysis Motivation & approach Analytical model Sensitivity analysis Case study Triggering Triggering convection convection by evaporation evaporation by enhanced enhanced March 28, 2018 Changing the evaporative fraction only: ~ 0.4 mm of extra water to evaporate to cross the LCL. Corresponding high CAPE Case study overview Case study overview
Case study Motivation approach Analytical model Sensitivity analysis Motivation & approach Analytical model Sensitivity analysis Case study LCL crossing LCL crossing by deep deep convection by enhanced enhanced evaporation convection unlikely unlikely evaporation, , March 31st, 2018 With a small increase in evaporation, LCL crossing likely to be achieved. CAPE 0 Case study overview Case study overview
Case study Motivation approach Analytical model Sensitivity analysis Motivation & approach Analytical model Sensitivity analysis Case study Enhanced Enhanced sensible strategy strategy for for deep May 25th, 2018 Increasing the sensible heat flux, e.g. by decreasing the surface albedo, may be a more achievable way to cross the LCL while still resulting in relatively high CAPE. Higher evaporation higher CAPE, but more total energy needed. sensible heat deep convection convection initiation heat may may be be a a better better initiation * * Mismatch surface measurements/initial boundary layer humidity assumption and ERA5 data Case study overview Case study overview
Case study Motivation approach Analytical model Sensitivity analysis Motivation & approach Analytical model Sensitivity analysis Case study Observed Observed convective convective precipitation precipitation (?) (?) precipitation May 7th, 2018 Favorable conditions for deep convection according to the model: LCL crossing with sufficient CAPE, close to origin. Precipitation observed Missing surface flux measurements Case study overview Case study overview
Data Data Dataset Used for Provided by ERA5 reanalysis on pressure levels Free atmosphere profiles of potential temperature and specific humidity Copernicus Climate Change Service, Climate Data Store, (2023): ERA5 hourly data on pressure levels from 1940 to present. Copernicus Climate Change Service (C3S) Climate Data Store (CDS), DOI: 10.24381/cds.bd0915c6 15 m measurements of temperature, RH, pressure Initial boundary layer conditions Efrat Schwartz and Dan Yakir, FLUXNET. Processed ceilometer data of boundary layer height and cloud base height Initial boundary layer height and cloud free day check. Dan Yakir, FLUXNET Eddy covariant measurement of turbulent heat and moisture fluxes Baseline (uncorrected for surface energy balance non-closure) Efrat Schwartz, FLUXNET. Case study overview Case study overview
Yatir Yatir Forest Forest The Yatir Forest Research site was setup as a field laboratory to investigate the tradeoffs among water use, carbon sequestration and radiation budgets in semi-arid ecosystem during climate change. The site is part of global FLUXNET, a global network of micrometeorological tower covariance methods to measure the exchanges of carbon dioxide, water vapor, and energy between terrestrial ecosystems and the atmosphere. More that 500 tower sites from about 30 regional networks across five continents are currently operating on a long-term basis. sites that use eddy www.weizmann.ac.il/EPS/Yakir/ biosphere-atmosphere-fluxes Visit the website Data from the site have been provided by Efrat Schwartz and Dan Yakir. Case study overview Case study overview
Wetsus Wetsus for sustainable sustainable water European European centre centre of excellence of excellence for water technology technology Wetsus, European centre of excellence for sustainable water technology is a facilitating intermediary for trendsetting know-how development. Wetsus creates a unique environment and strategic cooperation for development of profitable and sustainable state of the art water treatment technology. The inspiring and multidisciplinary collaboration between companies and research institutes from all over Europe in Wetsus results in innovations that contribute significantly to the solution of the global water problems. Wetsus scientific research program is defined by the private and public water sector and conducted by leading universities. www.wetsus.nl Visit the website
Sarah Warnau MSc. Sarah Warnau MSc. Sarah Warnau is PhD student at Wageningen University and Wetsus. Sarah.Warnau@Wetsus.nl Linkedin.com/in/sarah-warnau/
References References Cramer, W., Guiot, J., Marini, K., (2022). MedECC 2020 Summary for Policymakers . In: Climate and Environmental Change in the Mediterranean Basin Current Situation and Risks for the Future., First Mediterranean Assessment Report. Union for the Mediterranean, Plan Bleu, UNEP/ MAP, Marseille, France. Douville, H. et al. (2021). Water Cycle Changes . In: Climate Change 2021: The Physical Science Basis. Contribution of Working Group I to the Sixth Assessment Report of the Intergovernmental Panel on Climate Change [MassonDelmotte, V., P. Zhai, A. Pirani, S.L. Connors, C. P ean, S. Berger, N. Caud, Y. Chen, L. Goldfarb, M.I. Gomis, M. Huang, K. Leitzell, E. Lonnoy, J.B.R. Matthews, T.K. Maycock, T. Waterfield, O. Yelekci, R. Yu, and B. Zhou (Eds.)] Cambridge, United Kingdom and New York, NY, USA: Cambridge University Press, pp. 1055 1210 Miralles, Diego G. et al. (2019). Land Atmospheric Feedbacks during Droughts and Heatwaves: State of the Science and Current Challenges . In: Annals of the New York Academy of Sciences 1436.1, pp. 19 35. doi: 10.1111/nyas.13912. Yin, J., Albertson, J. D., Rigby, J. R., & Porporato, A. (2015). Land and atmospheric controls on initiation and intensity of moist convection: CAPE dynamics and LCL crossings. Water Resources Research, 51(10), 8476 8493. doi:10.1002/2015WR017286
