Economic and Social Outcomes by Race/Ethnicity in Vermont - REAP July 2020
This report presents data on economic and social outcomes by race/ethnicity in Vermont as of July 2020. It includes information on racial/ethnic population shares, education levels, school enrollment, and field of bachelor's degree for various racial/ethnic groups. Disparities and trends among different demographics are highlighted.

Uploaded on Sep 11, 2024 | 6 Views
Download Presentation

Please find below an Image/Link to download the presentation.
The content on the website is provided AS IS for your information and personal use only. It may not be sold, licensed, or shared on other websites without obtaining consent from the author.If you encounter any issues during the download, it is possible that the publisher has removed the file from their server.
You are allowed to download the files provided on this website for personal or commercial use, subject to the condition that they are used lawfully. All files are the property of their respective owners.
The content on the website is provided AS IS for your information and personal use only. It may not be sold, licensed, or shared on other websites without obtaining consent from the author.
E N D
Presentation Transcript
Economic and Social Outcomes by Race/Ethnicity in Vermont REAP July 2020
Data sources American Community Survey, 2013-18 averages Current Population, July 2019-June 2020 average
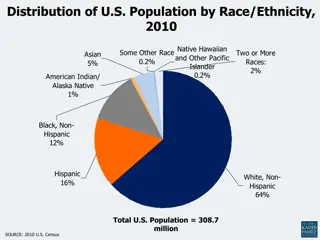
Racial/Ethnic Population Shares White 94.3% Black 1.7% Asian Native American Hispanic* Note: *includes white/non-white Hispanics. Source: ACS 2013-18 5-year average. 2.1% 1.1% 1.9%
School Enrollment Shares of Population 3+, 2013-18 average Almost half of Blacks 3 and older and more than a third of Asians are enrolled in school. Their share in college is 3 x greater than white shares. And shares are almost double those of whites in grad school. Hispanics and white have similar school enrollment shares as whites. Graduate/ Pro- fessional School 1.3% % Enrolled in School College White 23.1% 6.1% Black 47.1% 19.0% 2.3% Asian Native American Hispanic 38.4% 17.4% 2.2% NA NA NA 22.8% 6.0% 1.3%
Educational Attainment, 25+ Native American White Black Asian Hispanic Less Than High School High School Graduate/GED Some College/Associate's 4.1% 7.8% 10.1% 8.0% 4.1% 16.0% 12.2% 5.1% 11.0% 16.1% 11.5% 16.4% 5.0% 14.0% 11.5% Bachelor's Degree+ 16.8% 20.9% 20.7% 5.2% 16.8%
Minority/white educational attainment, 25+ 3.00 Blacks, Asians, and Native Americans have higher shares with less than HS and HS diploma than whites. Black and Asian shares with college degree + are also higher than for whites. Hispanics and whites have same educational attainment. 2.46 2.50 1.95 1.90 2.00 Less Than High School Diploma 1.50 High School Graduate/GED 1.00 1.00 Some College/Associate's 0.50 Bachelor's Degree+ 0.00
Field of Bachelor's Degree for First Major, 25 and over Science & Engineering Related Fields Arts, Science & Engineering Business Education Humanities & Other White 37.4% 8.1% 12.2% 13.4% 28.9% Black 40.0% 8.0% 11.6% 9.7% 30.7% Asian 52.2% 10.8% 13.3% 4.4% 19.4% Native American NA NA NA NA NA Hispanic 43.5% 5.7% 12.9% 8.0% 29.9% Shares of Black and Asian bachelor s in sciences equal to or higher than whites. These same groups are less represented in education.
Per capita and household annual income (2013-18) Ratio minority to white incomes 1.00 Median household income 0.92 Per capita income 0.85 0.90 0.80 0.72 0.70 0.62 0.60 0.54 0.50 White $33,952 $60,577 0.50 0.40 Black $18,376 $43,548 0.30 0.20 Asian $20,959 $55,568 0.10 0.00 Black Asian Hispanic Hispanic $17,019 $51,322 Per capita income Median household income narrower than for per capita income. For all minority groups, per capita income is below that of whites. Black and Hispanic per capita income is half that of whites. Household income for all minority groups is lower than that of whites but the gap
Poverty Rates Ratio minority rates to white rate Poverty Rate White Black Asian Native American Hispanic 2.5 10.7% 23.8% 15.4% 17.6% 16.2% 2.22 2.0 1.51 1.44 1.5 1.0 0.5 0.0 Black/white Asian/white Hispanic/white The Black poverty rate is double that of whites. For Asians and Hispanics, it is about 50% higher than for whites. Children s poverty rates are typically double those of the overall poverty rate for each racial group.
Occupational distribution, 16+ Natural Resources, Construction, & Maintenance Occupations Production, Transportation, & Material Moving Occupations Management, Business, Science & Arts Occupations Sales & Office Occupations Service Occupations Total White 41.9% 16.6% 20.0% 10.1% 11.4% 100.0% 30.3% 46.2% 36.4% 23.0% 15.0% 12.5% 5.4% 4.3% 12.9% 14.0% 100.0% 100.0% Black Asian Native American 27.9% 31.4% 15.5% 9.9% 15.3% 100.0% 36.1% 22.2% 21.2% 10.7% 9.8% 100.0% Hispanic Among lowest paid occupations Highest paid occupations
Labor Force Participation and Unemployment Rates - July 2019 to June 202, 16+ Labor force participation rate Unemployment rate 4.5% 9.1% 7.7% 65.2% 75.0% 74.1% White Black Hispanic The Black unemployment rate is double that of whites. The Hispanic unemployment rate is 70% higher than the white rate. Blacks and Hispanics have a larger share of their working age populations in the labor market.
Labor Force Participation and Unemployment Rates - July 2019 to June 2020, 16+ Labor force participation rate 62.3% 73.7% 70.9% Unemployment rate Females White Black Hispanic 4.2% 5.4% 3.9% Unemployment rate Labor force participation rate Males White Black Hispanic 4.9% 12.8% 10.8% 68.3% 76.3% 76.8% Racial differences in unemployment rates largely affects males.
Youth Labor Market Outcomes (16-19 years) Labor force participation rate Unemployment rate The Black youth unemployment rate is almost 5 times greater than the white rate. A larger share of Black and Hispanic youth are in the labor market. White 4.7% 40.8% Black 22.6% 47.2% Hispanic NA 47.9%
Housing Ratio of Black, Hispanic, and Asian shares of renters to white 3.0 2.8 Renter 2.5 28.4% 78.8% 48.2% 2.0 1.7 White 1.5 Black 1.0 1.0 Asian 0.5 Native American NA 0.0 28.1% Hispanic Black Asian Hispanic The share of Blacks who are renters is almost 3 times the white share. The share of Asians who are renters is 70% higher than the white share. Roughly the same share of whites and Hispanics are renters.
Transportation Car- Car- TransportationWalkedOther Public Worked at home Truck/Drov e alone Truck/Car pooled means 76.6% 8.4% 1.1% 5.3% 1.6% 7.0% White 62.0% 10.6% 6.3% 13.0% 3.8% 4.2% Black 55.0% 18.6% 4.0% 12.9% 4.3% 5.2% Asian Native American NA NA NA NA NA NA 64.0% 13.5% 3.3% 12.0% 1.3% 6.1% Hispanic Blacks and Asians rely more heavily than whites on public transportation. They also are more likely to walk and carpool. Whites are most likely among all groups to work at home.
Health Insurance: Percent with no insurance 19-64 65+ Under 19 Total 0.3% 3.7% 0.0% 4.0% White 0.2% 4.1% 0.0% 4.3% Black 2.1% 3.2% 0.2% 5.5% Asian 0.0% 7.0% 1.0% 8.0% Native American 0.5% 6.2% 0.1% 6.8% Hispanic Native Americans and Hispanics of working age are almost twice as likely to be uninsured as whites and Asians.