Early Childhood Funding Trends in Oklahoma
 undefined


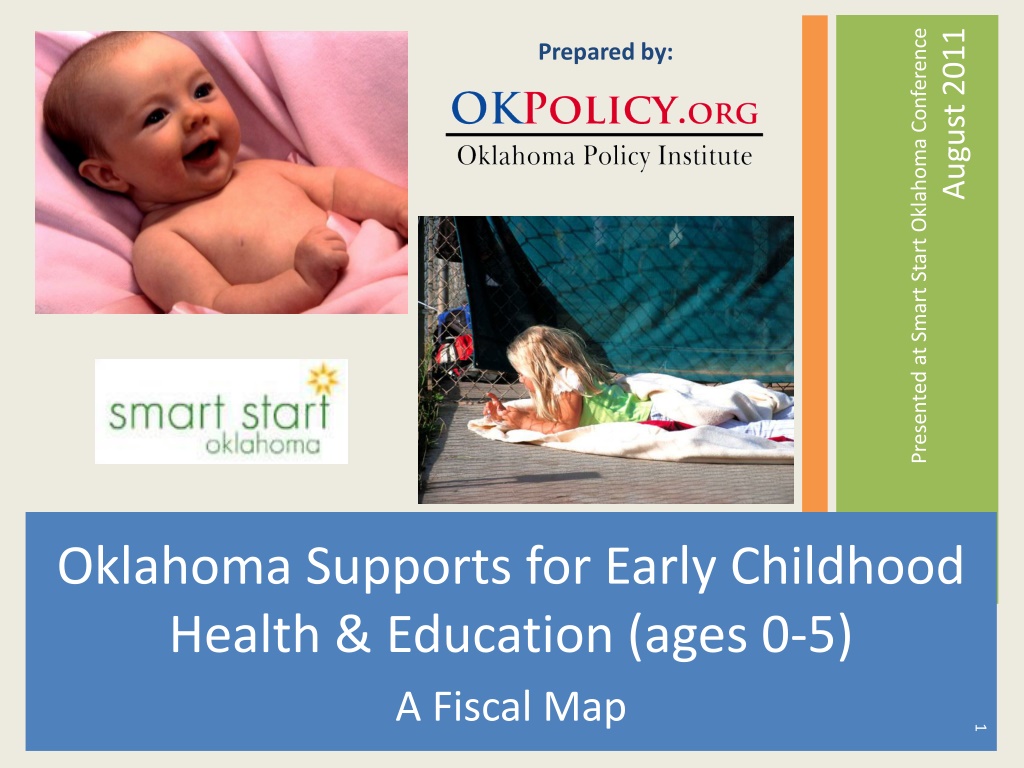
Oklahoma Supports for Early Childhood
Health & Education (ages 0-5)
A Fiscal Map

Presented at Smart Start Oklahoma Conference
August 2011

Prepared by:

1


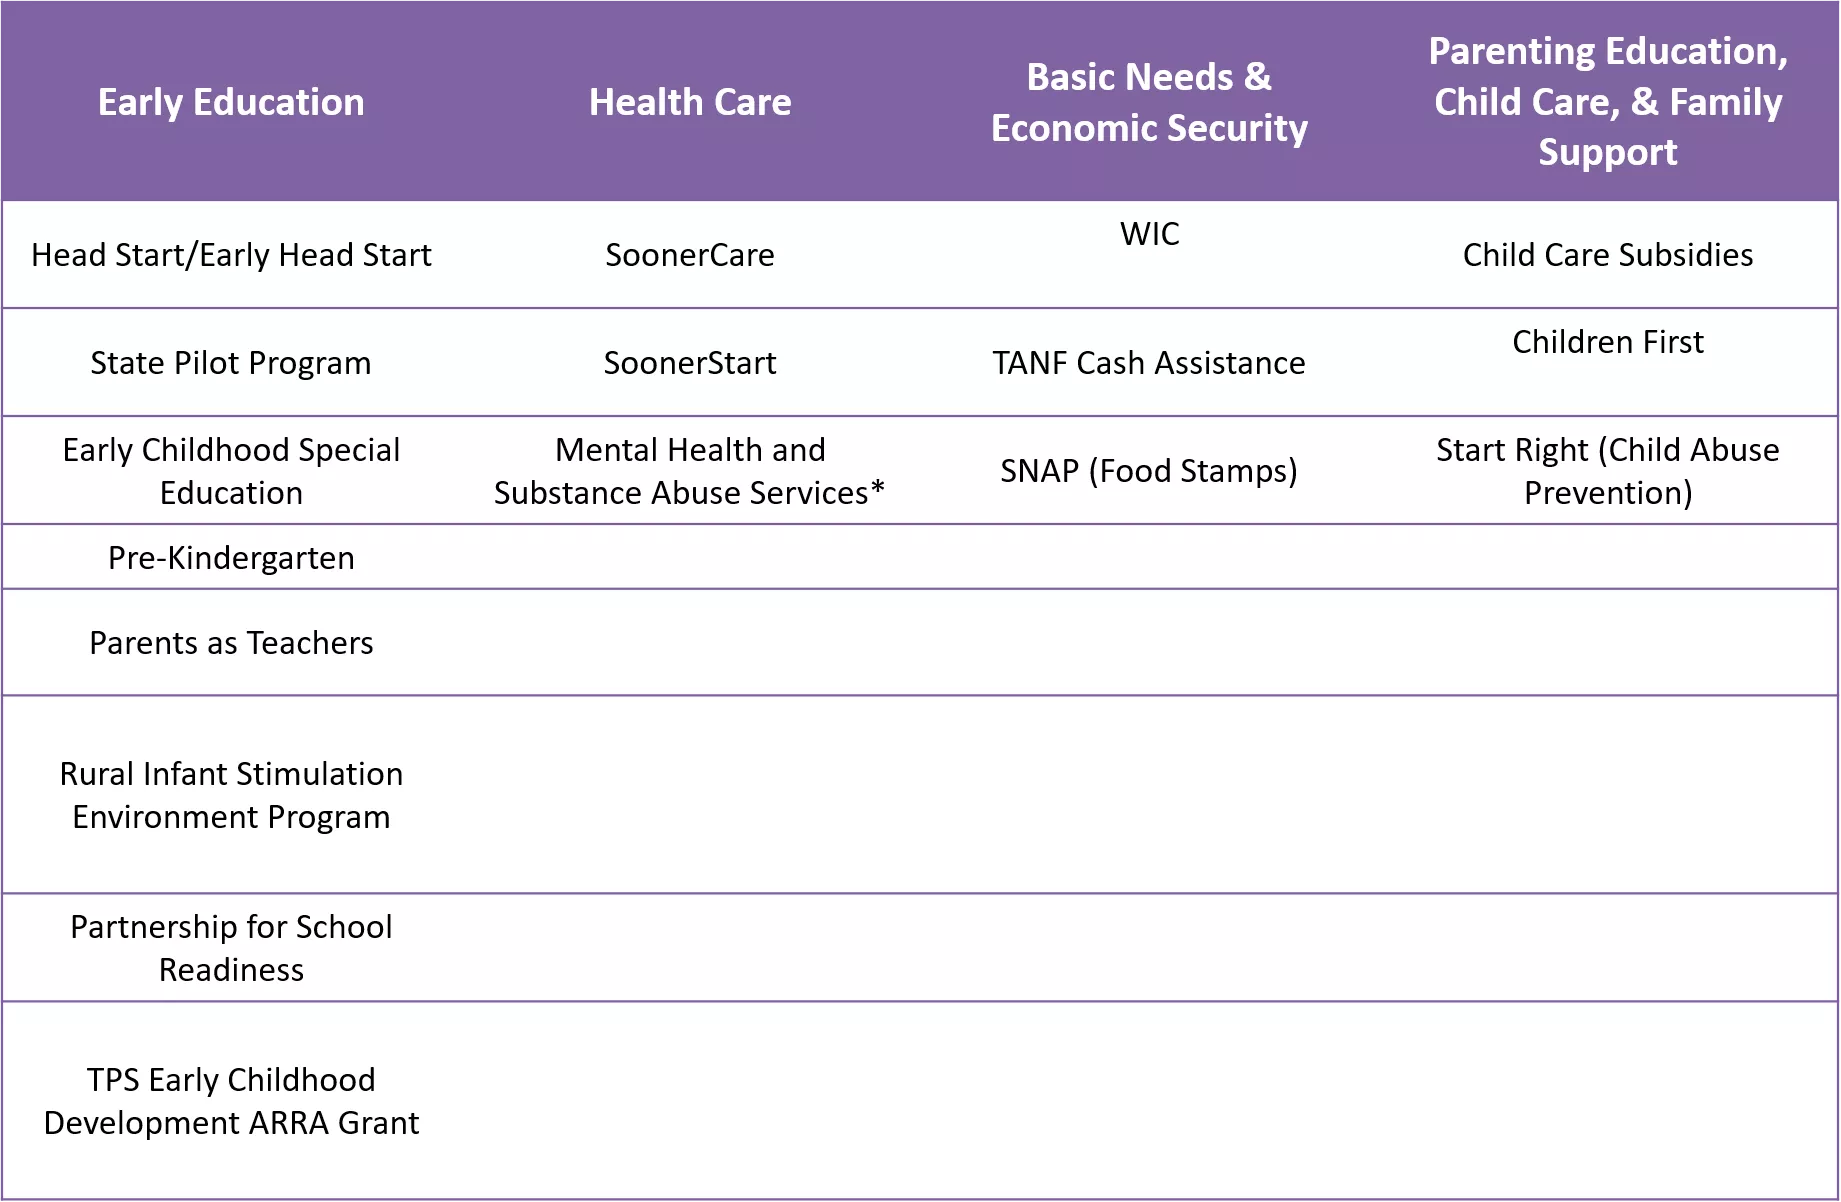
Major Programs Serving Oklahoma Children Ages 0-5
2
*Awaiting funding data.
Funding for children ages 0-5 by major goals,
FY 2010
3
Estimated Total Support for Early Childhood Health & Education in FY 2010:
$1.500 Billion
Funding Trends:
Major Programs Supporting Children Ages 0-5
4
Funding Trends:
Major Programs Supporting Children Ages 0-5
5
FY 2010 Snapshot:
Federal, State, Local, & Private Sources
Estimated Total Support for Early Childhood Health & Education in FY 2010:
$1.500 Billion
6
FY 2010 Snapshot
Major Funding Sources: Federal & State
•
Federal: $991.1 Million, 66 percent
–
Medicaid: $468,144,627
–
SNAP Benefits: $171,003,396
–
Head Start/Early Head Start: $110,588,469
–
TANF/CCDF: $95,885,299
–
WIC Food & Nutrition Service Grants: $71,250,712
–
TPS Early Childhood Development ARRA grant: $15,000,000
•
State: $384.6 Million, 26 percent
–
Department of Education: $195,279,946
–
OHCA SoonerCare Matching Funds: $143,925,147
–
OK DHS TANF/CCDF Matching Funds: $29,931,915
–
Health Department: $12,962,013
7
FY 2010 Snapshot
Major Funding Sources: Local & Private
•
Local: $73.4 Million, 5 percent
–
Pre-Kindergarten Local Support: $73,353,244
•
Private: $48.3 Million, 3 percent
–
Nestle Infant Formula Rebates for WIC: $20,703,620
–
George Kaiser Family Foundation: $16,277,989
–
Inasmuch Foundation: $2,792,500
–
Potts Family Foundation: $118,000
8
Funding Trends:
Federal, State, Local, & Private Sources
Overall funding since 2004 is comprised of about 1/4
th
state dollars, 2/3
rds
federal dollars, and 1/10
th
local and private dollars. Between ‘04 and ‘08,
state funding rose from 25 percent to 29 percent of the total. Since 2008,
federal spending has increased from 59 percent to 66 percent.
9
Spending on Young Children as a
Percentage of All Spending, FY 2009
FY 2009 spending on education for children
ages 0-5 made up about 1 out of every 20
dollars of all state spending on education.
In FY 2009, spending on children ages
0-5 made up about 1 out of every 10
dollars spent by the state.
Spending on children ages 0-5:
$1.38 billion
Total state direct expenditures:
$13.65 billion
Spending on education for children ages 0-5:
$0.43 billion
Total state education expenditures (including
postsecondary):
$7.39 billion
10
Total state expenditures numbers from 2009 Census Bureau state government finances data.
Major Programs: Head Start/Early Head Start
Head Start and Early Head Start provide
comprehensive child development
services to economically disadvantaged
children and families, with a special focus
on helping preschoolers develop the early
reading and math skills they need to be
successful in school. In Oklahoma, Head
Start programs are administered by
Community Action agencies, private
nonprofit agencies, American Indian
Tribes, and a school district. The programs
are funded primarily with federal grants ,
along with state funds through the
Oklahoma Department of Commerce.
11
Major Programs: Pre-Kindergarten
12
Since 2003, Oklahoma has ranked
1st in the nation for the percentage
of four-year-olds enrolled in
publicly-funded pre-k. The program
is supported with a combination of
federal, state, and local funds and
administered by local school
districts and the state Department
of Education. All pre-k teachers are
required to hold a bachelor's degree
and early childhood certification.
Percentage of Oklahoma four-year-olds
enrolled in a public pre-k program
Major Programs: SoonerCare
SoonerCare, Oklahoma's
Medicaid program, provides
comprehensive health care
coverage to eligible low-income
populations. Children in
Oklahoma are eligible for
SoonerCare up to 185 percent
of the federal poverty level.
The program serves
approximately 2/3
rds
of all
Oklahoma children ages 0-5.
13
Major Programs: WIC
The Women, Infants, and Children
federal grant funds supplemental
food, health care referrals, and
nutrition education for low-income
mothers and children up to age five
who are found to be at nutritional
risk. The program is funded by the
federal government and private
sources (Nestle Infant Formula
Rebates ) and is operated through
the State Health Department and
tribal governments
14
Major Programs: TANF Cash Assistance
TANF (Temporary Assistance for Needy
Families) provides time-limited cash
assistance to low-income families with
minor children who are deprived of
parental support because of the absence,
death, incapacity, or unemployment of at
least one parent. More than half of
Oklahoma TANF cases are “child-only
cases” in which no adult household
member receives assistance. Since 1996,
TANF is operated as a federal block grant
with a state matching requirement. Less
than 25 percent of TANF funds are spent
on cash assistance; most is spent on child
care and work support programs.
15
Major Programs: SNAP (Food Stamps)
The Supplemental Nutrition
Assistance Program (formerly
Food Stamps) provides a
monthly benefit for eligible low-
income households to purchase
groceries. The federal
government pays the full cost of
SNAP benefits and splits the cost
of administering the program
with states.
16
Major Programs: Child Care Subsidies
The Child Care Subsidy Program assists
qualifying families by paying all or part
of their child care costs in a licensed
home or center. To be eligible, families
must meet income requirements and
the adults in the home must be
engaged in qualifying activities such as
work or school. The Child Care Subsidy
Program is funded through a variety of
federal block grants, some of which
require state matching funds.
17
Additional Funding Opportunities
•
Race to the Top – Early Learning Challenge
–
$500 million state-level grant competition; Oklahoma is eligible for up to
$60 million.
–
Gives priority to states that establish public-private partnerships.
•
Affordable Care Act – Maternal, Infant and Early
Childhood Home Visiting Program
–
Funds for nurses, social workers, or other professionals to meet with at-
risk families in their homes and connect them with health care, early
education, parenting skills, child abuse prevention, and nutrition
assistance
–
Initial funding for Oklahoma is $1,920,105
–
First year’s funding focused on Kay and Garfield Counties, which were
ranked highest in needs assessment
18
Federal Budget Challenges
Efforts in Congress to address federal budget deficits
through spending cuts are likely to have a significant –
if uncertain – impact on funding for young children.
•
Budget Control Act of 2011
1.
Establishes caps on discretionary spending though
2021 to reduce federal deficits by $917 billion;
2.
Creates a Congressional Joint Select Committee on
Deficit Reduction to propose at least $1.2 trillion in
deficit reduction over 10 years;
3.
Implements automatic procedures (‘sequestration’) to
reduce spending by up to $1.2 trillion if select
committee does not achieve savings
19
Federal Budget Challenges
•
Budget Control Act of 2011
1.
Establishes caps on discretionary spending
though 2021 to reduce federal deficits by
$917 billion;
•
FY ‘12 spending cuts are modest (-$7 billion overall;
-$2 billion non-security);
•
For FY ‘13 – FY ‘20, spending allowed to increase but
by less than the CBO baseline projections (+0.4% in
FY ‘13, +1.8% - 2.2% FY ‘14 – FY ’21)
20
Federal Budget Challenges
•
Budget Control Act of 2011
2.
Creates a Congressional Joint Select
Committee on Deficit Reduction to propose at
least $1.2 trillion in deficit reduction over 10
years;
•
Committee has until November 2011 to make
recommendations, Congress has until December
2011 to approve;
•
Recommendations can include any combination of
spending cuts to discretionary or mandatory
programs, as well as revenue changes.
21
Federal Budget Challenges
•
Budget Control Act of 2011
3.
If select committee does not achieve savings, the Act
implements automatic procedures (‘sequestration’) to
reduce spending by up to $1.2 trillion over 10 years
•
Cuts on top of discretionary spending caps;
•
Cut begin in 2013 and would be divided equally between
defense and non-defense spending - $110 billion per year;
•
Exempted programs include: child nutrition, SNAP (food
stamps), child care entitlement to states, TANF, Medicaid and
CHIP, vaccines for children, Social Security, SSI, EITC;
•
Non-exempt programs include: Title I; Special Education state
grants (IDEA-Part B), Head Start, child welfare services, CSBG,
CCDBG (discretionary), SSBG;
–
Medicare payments to providers would be cut 2 percent.
–
Funding for community and migrant health centers and for Indian
health services and facilities cannot be cut more than 2 percent
•
Center on Budget and Policy Priorities: Automatic cuts would
represent approximately a 9 percent annual cut in affected
non-defense programs
22
About Us and Contact Information
This report was prepared for Smart Start Oklahoma and the Oklahoma Partnership for School
Readiness by the Oklahoma Policy Institute.
Launched in early 2008, Oklahoma Policy Institute (OK Policy) provides timely and credible
information, analysis and ideas on policy issues affecting Oklahoma. Our core commitments
are to the adequate, fair and fiscally responsible funding of public services, and to an
economy that provides shared prosperity through increased economic opportunity and
financial security for all.
We welcome your feedback. Send questions or comments to:
Gene Perry
Policy Analyst, Oklahoma Policy Institute
(918) 794-3944
gperry@okpolicy.org
23
David Blatt
Director, Oklahoma Policy Institute
(918) 794-3944
dblatt@okpolicy.org
Methods:
Requested funding info from foundations and state agencies; thanks to everyone who provided numbers.
We have numbers going back to 2000 in some cases; we concentrate in this report on the period of fiscal year 2004 to fiscal year 2010 because that’s what when could find comparable numbers for all of the major programs.
The numbers in this presentation represent funds going to support children ages 0-5, whether through direct education and health care services for the children or supports for new parents and pregnant women. It represents public programs and major philanthropy, but not payments by parents for child care, health care, or other goods for their children.
This document outlines the funding and major programs supporting children aged 0-5 in Oklahoma, including parenting education, child care, health care, and more. It highlights funding trends over the years and the distribution of support from federal, state, local, and private sources in FY 2010.

Download Presentation

Please find below an Image/Link to download the presentation.
The content on the website is provided AS IS for your information and personal use only. It may not be sold, licensed, or shared on other websites without obtaining consent from the author.If you encounter any issues during the download, it is possible that the publisher has removed the file from their server.
You are allowed to download the files provided on this website for personal or commercial use, subject to the condition that they are used lawfully. All files are the property of their respective owners.
The content on the website is provided AS IS for your information and personal use only. It may not be sold, licensed, or shared on other websites without obtaining consent from the author.
E N D
Presentation Transcript
August 2011 Presented at Smart Start Oklahoma Conference Prepared by: Oklahoma Supports for Early Childhood Health & Education (ages 0-5) A Fiscal Map 1
Major Programs Serving Oklahoma Children Ages 0-5 Parenting Education, Child Care, & Family Support Basic Needs & Economic Security Early Education Health Care WIC Head Start/Early Head Start SoonerCare Child Care Subsidies Children First State Pilot Program SoonerStart TANF Cash Assistance Early Childhood Special Education Mental Health and Substance Abuse Services* Start Right (Child Abuse Prevention) SNAP (Food Stamps) Pre-Kindergarten Parents as Teachers Rural Infant Stimulation Environment Program Partnership for School Readiness TPS Early Childhood Development ARRA Grant *Awaiting funding data. 2
Funding for children ages 0-5 by major goals, FY 2010 Estimated Total Support for Early Childhood Health & Education in FY 2010: $1.500 Billion Basic Needs & Economic Security $131.0M 9% $270.7M 18% Early Education $635.7M 43% Health Care $446.6M 30% Parenting Education, Child Care, & Family Support 3
Funding Trends: Major Programs Supporting Children Ages 0-5 1,600 Millions 1,400 Other 1,200 TANF Cash Assistance Children First 1,000 State Pilot Program SoonerStart 800 WIC Head Start/Early Head Start 600 Childcare Subsidies SNAP 400 Pre-Kindergarten SoonerCare 200 0 FY 04 FY 05 FY 06 FY 07 FY 08 FY 09 FY 10 4
Funding Trends: Major Programs Supporting Children Ages 0-5 700 Millions 600 500 400 300 200 100 0 FY 04 FY 05 FY 06 FY 07 FY 08 FY 09 FY 10 SoonerCare Pre-Kindergarten SNAP Childcare Subsidies Head Start/Early Head Start WIC SoonerStart State Pilot Program Children First TANF Cash Assistance Other 5
FY 2010 Snapshot: Federal, State, Local, & Private Sources Private, 48,183,481, 3% Local, 73,353,244, 5% State, 384,551,554, 26% Federal, 991,119,219, 66% Estimated Total Support for Early Childhood Health & Education in FY 2010: $1.500 Billion 6
FY 2010 Snapshot Major Funding Sources: Federal & State Federal: $991.1 Million, 66 percent Medicaid: $468,144,627 SNAP Benefits: $171,003,396 Head Start/Early Head Start: $110,588,469 TANF/CCDF: $95,885,299 WIC Food & Nutrition Service Grants: $71,250,712 TPS Early Childhood Development ARRA grant: $15,000,000 State: $384.6 Million, 26 percent Department of Education: $195,279,946 OHCA SoonerCare Matching Funds: $143,925,147 OK DHS TANF/CCDF Matching Funds: $29,931,915 Health Department: $12,962,013 7
FY 2010 Snapshot Major Funding Sources: Local & Private Local: $73.4 Million, 5 percent Pre-Kindergarten Local Support: $73,353,244 Private: $48.3 Million, 3 percent Nestle Infant Formula Rebates for WIC: $20,703,620 George Kaiser Family Foundation: $16,277,989 Inasmuch Foundation: $2,792,500 Potts Family Foundation: $118,000 8
Funding Trends: Federal, State, Local, & Private Sources Overall funding since 2004 is comprised of about 1/4thstate dollars, 2/3rds federal dollars, and 1/10thlocal and private dollars. Between 04 and 08, state funding rose from 25 percent to 29 percent of the total. Since 2008, federal spending has increased from 59 percent to 66 percent. Fiscal Year 2004 2005 2006 2007 2008 2009 2010 State 229,202,073 254,547,700 295,489,370 330,836,427 368,917,709 365,958,733 384,551,554 Federal 600,558,638 623,119,185 664,549,618 700,834,329 750,448,906 847,114,720 991,119,219 Local 53,402,443 64,751,891 70,565,067 76,705,358 89,641,404 101,897,546 73,353,244 Private 16,763,618 24,145,856 25,260,999 50,656,061 56,162,117 59,843,644 48,301,481 All Funding 899,926,772 966,564,632 1,055,865,054 1,159,032,175 1,267,444,778 1,376,853,819 1,500,495,498 9
Spending on Young Children as a Percentage of All Spending, FY 2009 In FY 2009, spending on children ages 0-5 made up about 1 out of every 10 dollars spent by the state. FY 2009 spending on education for children ages 0-5 made up about 1 out of every 20 dollars of all state spending on education. 6% 10% 90% 94% Spending on education for children ages 0-5: Spending on children ages 0-5: $0.43 billion $1.38 billion Total state education expenditures (including postsecondary): Total state direct expenditures: $13.65 billion $7.39 billion 10 Total state expenditures numbers from 2009 Census Bureau state government finances data.
Major Programs: Head Start/Early Head Start Head Start/Early Head Start Enrollment Head Start and Early Head Start provide comprehensive child development services to economically disadvantaged children and families, with a special focus on helping preschoolers develop the early reading and math skills they need to be successful in school. In Oklahoma, Head Start programs are administered by Community Action agencies, private nonprofit agencies, American Indian Tribes, and a school district. The programs are funded primarily with federal grants , along with state funds through the Oklahoma Department of Commerce. 21,000 20,500 20,000 19,500 19,000 18,500 18,000 17,500 FY '06 FY '07 FY '08 FY '09 FY '10 Fiscal Year FY '04 FY '05 FY '06 FY '07 FY '08 FY '09 FY '10 Region 6 Federal Funding $78.3M $81.3M $80.1M $80.3M $81.3M $83.7M $83.8M Region 6 State Funding N/A N/A $2.9M $2.9M $2.9M $2.7M $2.5M Region 11 (American Indian) $20.6M $20.6M $20.4M $20.7M $20.9M $23.1M $24.3M 11 Total Enrollment N/A N/A 19,651 19,819 19,771 19,745 20,649
Major Programs: Pre-Kindergarten Percentage of Oklahoma four-year-olds enrolled in a public pre-k program Since 2003, Oklahoma has ranked 1st in the nation for the percentage of four-year-olds enrolled in publicly-funded pre-k. The program is supported with a combination of federal, state, and local funds and administered by local school districts and the state Department of Education. All pre-k teachers are required to hold a bachelor's degree and early childhood certification. 71% 71% 71% 70% 68% 68% 64% 59% 56% 2002 2003 2004 2005 2006 2007 2008 2009 2010 Average Daily Attendance Total 34,621 Fiscal Year Average Daily Attendance Half-Day Average Daily Attendance Full-Day Funding 2010 14,491 19,680 $293.4 M 2009 14,850 18,290 33,140 $283.0 M 2008 15,666 16,420 32,086 $263.7 M 2007 16,260 15,236 31,496 $232.4 M 2006 16,672 14,122 30,794 $213.8 M 2005 16,479 13,206 29,685 $196.2 M 12 2004 15,453 10,843 26,296 $161.8 M
Major Programs: SoonerCare SoonerCare Enrollment, Ages 0-5 Unduplicated count as of June 30 each year SoonerCare, Oklahoma's Medicaid program, provides comprehensive health care coverage to eligible low-income populations. Children in Oklahoma are eligible for SoonerCare up to 185 percent of the federal poverty level. The program serves approximately 2/3rdsof all Oklahoma children ages 0-5. 215 Thousands 205 195 185 175 Jun-05 Jun-06 Jun-07 Jun-08 Jun-09 Jun-10 Jun-05 Jun-06 Jun-07 Jun-08 Jun-09 Jun-10 Date Children Age 0-5 Enrolled 184,916 188,814 193,023 200,641 204,681 212,736 Percent of Total SoonerCare population 26.5% 25.4% 25.3% 25.2% 24.8% 24.0% Funding over fiscal year $353.5 M $412.7 M $463.6 M $509.5 M $553.9 M $612.1 M 13
Major Programs: WIC The Women, Infants, and Children federal grant funds supplemental food, health care referrals, and nutrition education for low-income mothers and children up to age five who are found to be at nutritional risk. The program is funded by the federal government and private sources (Nestle Infant Formula Rebates ) and is operated through the State Health Department and tribal governments Average Monthly WIC Caseload 110 Thousands 105 100 95 90 85 80 FY '01 FY '02 FY '03 FY '04 FY '05 FY '06 FY '07 FY '08 FY '09 FY '10 Federal Fiscal Year FY '01 FY '02 FY '03 FY '04 FY '05 FY '06 FY '07 FY '08 FY '09 FY '10 Total Funding $63,360,830 $65,885,891 $66,556,897 $66,962,917 $72,795,881 $75,711,011 $78,476,266 $91,618,418 $96,534,512 $91,954,332 Average Monthly Caseload 87,467 90,418 91,389 92,618 94,724 94,288 94,741 97,315 102,793 105,104 14
Major Programs: TANF Cash Assistance TANF (Temporary Assistance for Needy Families) provides time-limited cash assistance to low-income families with minor children who are deprived of parental support because of the absence, death, incapacity, or unemployment of at least one parent. More than half of Oklahoma TANF cases are child-only cases in which no adult household member receives assistance. Since 1996, TANF is operated as a federal block grant with a state matching requirement. Less than 25 percent of TANF funds are spent on cash assistance; most is spent on child care and work support programs. TANF Cash Assistance for Children 0-5 $14 Millions $12 $10 $8 $6 2000 2001 2002 2003 2004 2005 2006 2007 2008 2009 2010 2011 Fiscal Year FY 02 FY 03 FY '04 FY '05 FY '06 FY '07 FY '08 FY '09 FY '10 Average Monthly Enrollment, Ages 0-5 9,915 10,473 9,992 9,171 7,816 6,856 6,108 6,070 7,235 Annual Total Expenditures, Ages 0-5 $11.0M $11.3M $10.8M $9.8M $8.3M $7.3M $6.3M $6.4M $7.8M Monthly Average Payment Per Case (all cases) $213 $220 $220 $214 $207 $216 $186 $202 $240 15
Major Programs: SNAP (Food Stamps) Supplemental Nutrition Assistance Program, Annual Payments, Ages 0-5 The Supplemental Nutrition Assistance Program (formerly Food Stamps) provides a monthly benefit for eligible low- income households to purchase groceries. The federal government pays the full cost of SNAP benefits and splits the cost of administering the program with states. $200 Millions $160 $120 $80 $40 2000 2001 2002 2003 2004 2005 2006 2007 2008 2009 2010 2011 Fiscal Year FY 02 FY 03 FY '04 FY '05 FY '06 FY '07 FY '08 FY '09 FY '10 Annual Total Expenditures, Ages 0-5 $58.1 M $76.9 M $85.5 M $93.1 M $98.4 M $99.3 M $102.8 M $125.0 M $171.0 M Average Monthly Enrollment, ALL AGES 298,204 367,993 406,004 421,442 433,372 423,084 415,397 445,364 559,626 Monthly Average Benefit, All Cases $75 $78 $80 $85 $89 $91 $97 $110 $128 16
Major Programs: Child Care Subsidies Child Care Subsidy Expenditures, Children Aged 0-5, SFY 2002-2011 The Child Care Subsidy Program assists qualifying families by paying all or part of their child care costs in a licensed home or center. To be eligible, families must meet income requirements and the adults in the home must be engaged in qualifying activities such as work or school. The Child Care Subsidy Program is funded through a variety of federal block grants, some of which require state matching funds. $130 $120 $110 Millions $100 $90 $80 $70 2002 2003 2004 2005 2006 2007 2008 2009 2010 2011 Fiscal Year FY 02 FY 03 FY '04 FY '05 FY '06 FY '07 FY '08 FY '09 FY '10 Annual Total Expenditures, Ages 0-5 $89.8M $104.4M $110.6M $99.2M $100.0M $98.2M $98.8M $111.5M $118.1M Unduplicated Annual Enrollment, Ages 0-5 62,035 66,232 61,905 58,912 56,875 53,812 52,050 50,702 51,772 17
Additional Funding Opportunities Race to the Top Early Learning Challenge $500 million state-level grant competition; Oklahoma is eligible for up to $60 million. Gives priority to states that establish public-private partnerships. Affordable Care Act Maternal, Infant and Early Childhood Home Visiting Program Funds for nurses, social workers, or other professionals to meet with at- risk families in their homes and connect them with health care, early education, parenting skills, child abuse prevention, and nutrition assistance Initial funding for Oklahoma is $1,920,105 First year s funding focused on Kay and Garfield Counties, which were ranked highest in needs assessment 18
Federal Budget Challenges Efforts in Congress to address federal budget deficits through spending cuts are likely to have a significant if uncertain impact on funding for young children. Budget Control Act of 2011 1. Establishes caps on discretionary spending though 2021 to reduce federal deficits by $917 billion; 2. Creates a Congressional Joint Select Committee on Deficit Reduction to propose at least $1.2 trillion in deficit reduction over 10 years; 3. Implements automatic procedures ( sequestration ) to reduce spending by up to $1.2 trillion if select committee does not achieve savings 19
Federal Budget Challenges Budget Control Act of 2011 1. Establishes caps on discretionary spending though 2021 to reduce federal deficits by $917 billion; FY 12 spending cuts are modest (-$7 billion overall; -$2 billion non-security); For FY 13 FY 20, spending allowed to increase but by less than the CBO baseline projections (+0.4% in FY 13, +1.8% - 2.2% FY 14 FY 21) 20
Federal Budget Challenges Budget Control Act of 2011 2. Creates a Congressional Joint Select Committee on Deficit Reduction to propose at least $1.2 trillion in deficit reduction over 10 years; Committee has until November 2011 to make recommendations, Congress has until December 2011 to approve; Recommendations can include any combination of spending cuts to discretionary or mandatory programs, as well as revenue changes. 21
Federal Budget Challenges Budget Control Act of 2011 3. If select committee does not achieve savings, the Act implements automatic procedures ( sequestration ) to reduce spending by up to $1.2 trillion over 10 years Cuts on top of discretionary spending caps; Cut begin in 2013 and would be divided equally between defense and non-defense spending - $110 billion per year; Exempted programs include: child nutrition, SNAP (food stamps), child care entitlement to states, TANF, Medicaid and CHIP, vaccines for children, Social Security, SSI, EITC; Non-exempt programs include: Title I; Special Education state grants (IDEA-Part B), Head Start, child welfare services, CSBG, CCDBG (discretionary), SSBG; Medicare payments to providers would be cut 2 percent. Funding for community and migrant health centers and for Indian health services and facilities cannot be cut more than 2 percent Center on Budget and Policy Priorities: Automatic cuts would represent approximately a 9 percent annual cut in affected non-defense programs 22
About Us and Contact Information This report was prepared for Smart Start Oklahoma and the Oklahoma Partnership for School Readiness by the Oklahoma Policy Institute. Launched in early 2008, Oklahoma Policy Institute (OK Policy) provides timely and credible information, analysis and ideas on policy issues affecting Oklahoma. Our core commitments are to the adequate, fair and fiscally responsible funding of public services, and to an economy that provides shared prosperity through increased economic opportunity and financial security for all. We welcome your feedback. Send questions or comments to: Gene Perry Policy Analyst, Oklahoma Policy Institute (918) 794-3944 gperry@okpolicy.org David Blatt Director, Oklahoma Policy Institute (918) 794-3944 dblatt@okpolicy.org 23


")