Double-blind, Randomized Trial of Interatrial Shunt in HF Patients
This study details the principal results of the RELIEVE-HF trial, investigating the safety and effectiveness of the V-Wave Ventura interatrial shunt device in patients with heart failure with reduced and preserved ejection fraction. Key inclusion and exclusion criteria are outlined, emphasizing the aim to improve HF symptoms and prognosis through autoregulatory mechanisms. The trial design encompassed stratified randomizations based on LVEF status, with the V-Wave Ventura shunt demonstrating potential benefits in reducing left atrial pressure and enhancing cardiac function.
Download Presentation

Please find below an Image/Link to download the presentation.
The content on the website is provided AS IS for your information and personal use only. It may not be sold, licensed, or shared on other websites without obtaining consent from the author.If you encounter any issues during the download, it is possible that the publisher has removed the file from their server.
You are allowed to download the files provided on this website for personal or commercial use, subject to the condition that they are used lawfully. All files are the property of their respective owners.
The content on the website is provided AS IS for your information and personal use only. It may not be sold, licensed, or shared on other websites without obtaining consent from the author.
E N D
Presentation Transcript
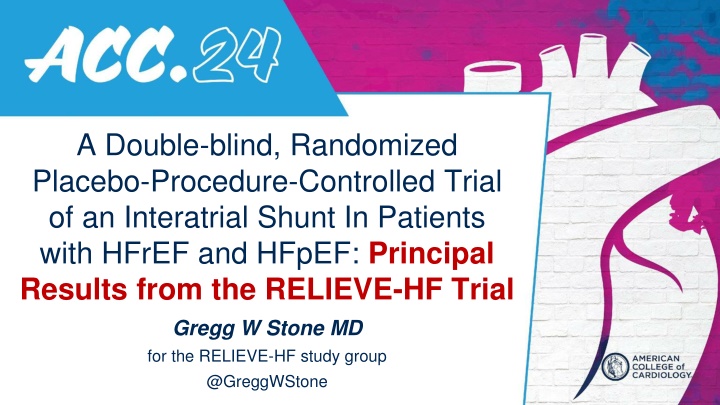
A Double-blind, Randomized Placebo-Procedure-Controlled Trial of an Interatrial Shunt In Patients with HFrEF and HFpEF: Principal Results from the RELIEVE-HF Trial Gregg W Stone MD for the RELIEVE-HF study group @GreggWStone
Background Heart failure (HF) is characterized by increased left atrial pressure and pulmonary venous congestion Left atrial pressure rises with exercise and fluid overload and may be difficult to regulate pharmacologically An inter-atrial shunt (IAS) may provide an autoregulatory mechanism to decrease left atrial pressure and improve HF symptoms and prognosis In pilot studies, the Ventura IAS (V-Wave Ltd.) reduced filling pressures, improved cardiac structure and function, and provided symptomatic relief and functional improvement in patients with HFrEF and HFpEF
Objectives and Trial Design We therefore sought to determine the safety and effectiveness of the V-Wave Ventura IAS device in symptomatic HF patients with any LVEF in a randomised, double-blind, placebo-procedure-controlled, multicenter trial Given uncertainty as to whether the response to an IAS would vary according to systolic function, stratified randomizations were performed in patients with reduced ( 40%) and preserved (>40%) LVEF
V-Wave Ventura Inter-atrial Shunt Length: 12mm; LA diameter: 14mm; RA diameter: 11mm; Neck diameter: 5.1mm; Qp/Qs: approximately 1.2:1
Key Inclusion Criteria 1. Ischemic or non-ischemic cardiomyopathy with any LVEF and documented HF for at least 6 months 2. NYHA class II, III, or ambulatory IV functional class despite maximally-tolerated class I GDMT and cardiac rhythm management device therapy for HF as assessed by a central eligibility committee 3. HF hospitalization within the prior 12 months and/or an elevated (BMI-adjusted) BNP/NT-proBNP (both required for NYHA II) 4. 6MWT 100 meters - 450 meters 5. Written, informed consent
Key Clinical Exclusion Criteria 1. Resting SBP <90 or >160 mmHg or intractable HF 2. Severe pulmonary hypertension defined as PASP >70 mmHg by echo/Doppler or PVR >4.0 WU on RHC that cannot be reduced by vasodilator therapy 3. RV dysfunction defined as TAPSE <12 mm or RVFAC 25% on TTE 4. LVEDD >8 cm on TTE 5. ASD, PFO, APVR, corrected CHD, severe valve lesions 6. Transseptal procedure for another indication planned within 6 months
Final Key Exclusion Criteria After RHC and TEE/ICE - performed just prior to randomization - 1. Anatomical anomaly that precludes implanting the IAS across the fossa ovalis (FO) including: Minimal FO thickness >6 mm or length <10 mm; ASD or PFO with >trace shunting; atrial septal aneurysm; intracardiac thrombus 2. Hemodynamic, heart rhythm, or respiratory instability including: Mean PCWP <7 mmHg or >35 mmHg; RAP LAP (or PCWP) when LAP (PCWP) is 7 mmHg; CI <1.5 L/min/m2; severe pulmonary HTN as previously defined, SBP <90 or >160 mmHg; need for IV vasopressor or inotrope medication; malignant arrhythmias; acute respiratory distress or hypoxemia
RELIEVE-HF Primary Effectiveness Endpoint Comparison between groups of the hierarchical composite ranking of: All-cause death Cardiac transplantation or left ventricular assist device (LVAD) implantation All HF hospitalizations All outpatient worsening HF events Change in KCCQ-OS from baseline to 12 months (5-point minimum difference) Analyzed by the Finkelstein-Schoenfeld method when the last enrolled patient reaches 12 months with longest FU to 24 months, expressed as the win ratio A single interim analysis of the primary effectiveness outcome with adaptive sample size re-estimation by an independent third party was planned when 200 enrolled patients completed 6-month follow-up. To prevent inflation of type-1 error the final FS statistic is derived from data weighted differently before and after the interim analysis.* *Cui L, Hung HMJ, Wang S-J. Biometrics 1999;55:853-857
RELIEVE-HF Primary Safety Endpoint Device-related or procedure-related MACNE (all-cause death, stroke, systemic embolism or need for open cardiac surgery or major endovascular surgical repair) at 30 days in the IAS group, compared against an OPC of 11% Numerous additional secondary safety and effectiveness endpoints were pre-specified All primary and secondary endpoints will be tested in the randomized strata of patients with reduced and preserved LVEF
Study Leadership and Organization Principal investigators: Stefan D. Anker, JoAnn Lindenfeld, Josep Rod s-Cabau, Gregg W. Stone Executive Committee: PIs + Michael Zile, Saibal Kar, John Gorcsan, Rich Holcomb, William T. Abraham Steering Committee: EC + Maria Rosa Costanzo, Antoni Bayes-Genis, Jeroen Bax, Alan Bank, Stefan Verheye, Ariel Roguin, Gerasimos Filippatos, Stephan von Bardeleben, Raj Makkar, Tom McRae, Wayne Batchelor, Frank Ruschitzka, Berkert Pieske Central Eligibility Committee: Michael Zile (moderator), JoAnn Lindenfeld, Jeroen Bax, Alan Bank, Maria Rosa Costanzo, Gregg W. Stone, Josep Rodes-Cabau, Ariel Roguin, Stefan Verheye Echocardiographic Core Laboratory: Penn State Health-Milton S. Hershey Medical Center: Michael P. Pfeiffer (director), 1/26/21-current; Washington University: John Gorcsan (director), 2/24/18-1/26/21 Clinical Endpoints Committee: Cardiovascular Research Foundation (CRF); Marrick Kukin (chair) Data Safety Monitoring Board: CRF; Bernard Gersh (chair) Data management and biostatistics: CRF; Ovidiu Dressler and Yiran Zhang Site management and data monitoring: V-Wave Ltd. Sponsor and funding: V-Wave Ltd.
Patient Flow 0 Lost-to-FU 0 Withdrew 0 Lost-to-FU 1 Withdrew 0 Lost-to-FU 1 Withdrew Roll-in cases N=97 Shunt implanted 1136 patients were screened for enrollment at 113 sites in 11 countries (USA, Canada, Israel, Germany, Spain, Switzerland, Belgium, Poland, The Netherlands, Australia, and New Zealand N=250/250 (100%) N=249/250 (99.6%) N=150/151 (99.3%) Inter-atrial shunt N=250 Randomized N=508 at 94 sites between Oct 24, 2018 and Oct 19, 2022 Enrolled N=605 at 101 sites 12-mo FU (primary endpoint minimum) Randomized 1:1 Stratified by core lab LVEF 40% vs. >40% and site 24-mo FU (eligible pts) 30-d FU N=258/258 (100%) N=256/258 (99.2%) N=133/137 (97.1%) Placebo-procedure N=258 Ineligible N= 531 Patients and all post-cath lab personnel were blinded 0 Lost-to-FU 0 Withdrew 0 Lost-to-FU 2 Withdrew 0 Lost-to-FU 4 Withdrew All inclusion criteria not met (n=212) Exclusion criteria present (n=182) Not approved by eligibility committee (n=17) Failed final eligibility assessment in the cath lab (n= 60) Withdrew consent during screening (n=33) Incomplete screening or other (n= 24) Death during screening (n=3) Post-procedure patients not on OAC were treated with open-label aspirin (75- 100 mg per day) for 2 years + study drug clopidogrel (75 mg per day in the IAS group vs. matching placebo in the control group) for 6 months Median follow-up 22.0 (13.3, 23.9) months
Top 12 Randomizing Sites PI Hospital, City, State, Country N randomized Julio N ez Hospital Cl nico Universitario, INCLIVA, University of Valencia, Valencia, Spain Institut universitaire de cardiologie et de pneumologie de Qu bec - Universit Laval, Quebec City, Quebec, Canada Rochester General Health System, Rochester, NY, US 32 Josep Rod s-Cabau 25 Elizabeth Lee 23 Antoni Bayes Genis Hospital Universitari Germans Trias and Pujol de Badalona, Barcelona, Spain Tel Aviv Sourasky Medical Center, affiliated with the Tel Aviv School of Medicine, Tel Aviv University, Tel Aviv, Israel Assaf HaRofeh Medical Center, Beer Yaakov, Israel 19 Michal Laufer-Perl 18 Gil Moravsky 17 Sheldon Litwin Medical University of South Carolina, Charleston, South Carolina, US 15 Hemal Gada UPMC Pinnacle / Pinnacle Health Cardiovascular Institute, Harrisburg, PA, US 14 Edgard Prihadi Antwerp Cardiovascular Center, ZNA Middelheim Hospital, Antwerpen, Belgium 13 Dimitry Schewel Marienkrankrankenhas, Hamburg, Germany 12 Eugene Chung Lindner Center for Research and Education at The Christ Hospital, Cincinnati, OH, US 12 Matthew Price Scripps Clinic, La Jolla, CA, US 12
Baseline Characteristics (1) Shunt group (N=250) 74.0 (67.0, 79.0) 162 (64.8%) 30.0 (25.6, 34.9) 124 (49.6%) 209 (83.6%) 201 (80.4%) 133 (53.2%) 43 (17.2%) 43 (17.2%) 114 (45.6%) 136 (54.4%) 128 (51.2%) 169 (67.6%) 104 (41.6%) 103 (41.2%) 65 (26.0%) Placebo group (N=258) 72.0 (65.0, 78.0) 157 (60.9%) 30.3 (26.2, 36.0) 125 (48.4%) 216 (83.7%) 195 (75.6%) 137 (53.1%) 48 (18.6%) 52 (20.2%) 120 (46.5%) 138 (53.5%) 127 (49.2%) 160 (62.0%) 103 (39.9%) 96 (37.2%) 58 (22.5%) Age, years Sex, male Body mass index, kg/m2 Diabetes mellitus Hypertension Hyperlipidemia Current or previous smoker Prior stroke or TIA COPD Ischemic cardiomyopathy Non-ischemic cardiomyopathy At least one HFH in the prior year Known CAD Prior MI Prior PCI Prior CABG
Baseline Characteristics (2) Shunt group (N=250) 170 (60.8%) 76 (30.4%) 115 (46.0%) 70 (28.0%) 9 (3.6%) 239 (95.6%) 2 (0.8%) 52.1 (35.4, 66.9) 264.8 (195.5, 325.0) 45.4 (33.4, 58.9) 101/250 (40.4%) 149/250 (59.6%) 237.9 (117.2, 412.5) 1939.4 (1066.0, 3259.0) 45.5 (37.5, 59.8) 188 (75.2%) Placebo group (N=258) 159 (61.2%) 64 (24.8%) 123 (47.7%) 59 (22.9%) 7 (2.7%) 251 (97.3%) 0 (0.0%) 50.8 (34.6, 66.4) 270.9 (198.0, 330.0) 45.3 (33.3, 57.4) 105/258 (40.7%) 153/258 (59.3%) 221.0 (101.0, 518.3) 1596.6 (852.0, 2868.1) 48.5 (37.2, 60.8) 188 (72.9%) History of atrial fibrillation or flutter - Baseline rhythm is atrial fib or flutter ICD or CRT-D CRT-D or CRT-P NYHA class II NYHA class III NYHA class IV KCCQ overall summary score Six-minute walk distance, m LVEF (biplane, core lab assessment), % - 40% (reduced LVEF) - >40% (preserved LVEF) BNP (pg/mL) NT-proBNP(pg/mL) eGFR, mL/min/1.73 m2 - <60 mL/min/1.73 m2
Baseline TTE (core-lab) Shunt group (N=250) Placebo group (N=258) 123.3 (87.0, 175.5) 66.3 (37.5, 115.5) 78.5 (63.5, 103.0) 54.0 (41.0, 67.0) 26.7 (21.7, 31.9) 3.7 (2.9, 4.6) 1.8 (1.5, 2.2) 37.7 (33.3, 42.9) 16.5 (14.0, 20.0) 32.0 (24.0, 41.0) 9.8 (8.2, 11.9) 1.6 (1.2, 2.0) 49 (19.6%) 50/247 (20.2%) 126.0 (96.0, 181.5) 70.0 (40.5, 117.0) 76.0 (59.5, 101.0) 54.0 (44.0, 67.0) 27.5 (21.8, 33.0) 3.8 (3.1, 4.7) 1.9 (1.5, 2.3) 37.5 (33.3, 42.9) 17.0 (14.0, 19.0) 32.0 (25.0, 40.0) 10.4 (8.4, 12.4) 1.6 (1.2, 1.9) 38 (14.7%) 45/257 (17.5%) LVEDV (biplane), mL LVESV (biplane), mL LAV (biplane), mL SV, mL SVI, mL/m2 CO, L/min CI, L/min/m2 RV FAC, % TAPSE, mm PASP, mmHg RVEDAI, cm2/m2 IVC diameter max, cm MR moderate or greater TR moderate or greater
Baseline Right Heart Catheterization Shunt group (N=250) 67.0 (60.0, 75.0) Placebo group (N=258) 68.0 (60.0, 77.0) HR, bpm 116.0 (104.0, 133.0) 115.0 (103.0, 134.0) SBP, mmHg 64.0 (57.0, 73.0) 65.0 (59.0, 73.0) DBP, mmHg 9.0 (6.0, 12.0) 9.0 (6.0, 11.0) Mean RAP, mmHg 37.0 (30.0, 45.0) 37.0 (31.0, 44.0) Systolic PAP, mmHg 25.0 (21.0, 31.0) 25.0 (20.0, 30.0) Mean PAP, mmHg 2.1 (1.5, 3.1) 2.0 (1.4, 2.8) PVR, WU 15.5 (12.0, 20.0) 16.0 (12.0, 21.0) PCWP, mmHg 4.2 (3.4, 5.3) 4.3 (3.6, 5.3) CO, L/min 2.1 (1.8, 2.6) 2.2 (1.8, 2.6) CI, L/min/m2
Procedural Details Shunt group (N=250) Placebo group (N=258) Difference [95% CI] 80 (59, 100) 43 (30, 55) 35.5 [31.0, 40.0] Procedure duration, minutes 14 (10, 21) 4 (2, 7) 9.9 [8.9, 10.9] Fluoroscopy time, minutes 0.0 (0.0, 0.0) 0.0 (0.0, 0.0) 0.0 (0.0, 0.0) Contrast administered, mL 9000 (7000, 12,000) - - Heparin administered, units 291 (246, 342) - - Activated clotting time, secs 250 (100%) 1 (0.4%)* - Shunt implant attempt 250 (100%) 1 (0.4%) - - Shunt implanted successfully 1 (1, 1) 1 (1, 1) 0.0 [0.0, 0.0] Hospital duration post procedure, days *Site randomization error
RELIEVE-HF Primary Safety Endpoint Device-related or procedure-related MACNE (all-cause death, stroke, systemic embolism or need for open cardiac surgery or major endovascular surgical repair) at 30 days in the IAS group, compared against an OPC of 11% Within 30 days, MACNE occurred in 0 (0.0%) of 250 patients in the IAS group (upper 1-sided 97.5% CL = 1.5%), which is below the 11% performance goal, P<0.0001 using an exact binomial test MACNE occurred in 0 (0.0%) IAS-treated patients through 2-year FU
RELIEVE-HF Primary Effectiveness Endpoint Patient pairs N = 64,500 Placebo group N = 258 Shunt group N = 250 Wins Tie s Losses % of decisions Shunt group outcomes 5424 51,461 7615 21.4% Level 1: All-cause death Level 2: Cardiac transplantation or LVAD implantation 117 7 50,122 162 2.2% 9264 30,271 10,587 32.5% Level 3: Heart failure hospitalizations Level 4: Out-patient worsening heart failure events 3921 22,488 3862 12.8% Level 5: Change in KCCQ from baseline by at least 5 points 8876 3533 10,079 31.1% Total wins = 28,662, total losses = 32,305 Win ratio (unweighted) = 28,662/32,305 = 0.89 (0.72, 1.09) Win ratio (phase weighted for interim analysis) = 0.86 (0.61, 1.22); p=0.20
Risk of all Cardiovascular Events - All-cause death, LVAD/HT, all HFHs, and all out-patient worsening HF events -
Risk of all Cardiovascular Events - All-cause death, LVAD/HT, all HFHs, and all out-patient worsening HF events - Shunt group (N=101) 219/392.7 (55.7%/year) Placebo group (N=108) 222/396.1 (56.0%/year) 2-year rates RR or HR (95% CI) P-value 1.00 (0.83, 1.20) 0.96 All events1 35 (15.6%) 27 (13.7%) 1.31 [0.79, 2.16] 0.30 All-cause death2 2 (0.8%) 2 (1.1%) 1.01 [0.14, 7.14] 1.00 LVAD/HT2 128/392.7 (32.6%/year) 125/396.1 (31.6%/year) 1.09 [0.79, 1.50] 0.60 All HFHs1,3 55/392.7 (14.0%/year) 64/396.1 (16.2%/year) 0.88 [0.61, 1.26] 0.48 All out-pt WHFs1,3 1Total no. of events/total no. of patient-years of follow-up (annualized rate) with relative rate ratio (95% CI) 2Time-to-first event analysis n events (Kaplan-Meier estimated rate) with HR (95% CI) from a Cox model 3HR (95% CI) from a joint frailty model accounting for the competing risk of death
Change in KCCQ-OSS Over Time Change from baseline through 1 year 9.4 21.6 vs. 10.2 21.3, P=0.74
Primary Effectiveness Outcome by LVEF LVEF 40% (n=206) LVEF >40% (n=302) Pinteraction=0.0275
Risk of all Cardiovascular Events by LVEF - All-cause death, LVAD/HT, all HFHs, and all out-patient worsening HF events - LVEF 40% (n=206) LVEF >40% (n=302) Pinteraction<0.0001
Risk of all Cardiovascular Events by LVEF - All-cause death, LVAD/HT, all HFHs, and all out-patient worsening HF events - LVEF 40% LVEF >40% Shunt group (N=101) Placebo group (N=108) RR or HR (95% CI) Shunt group (N=149) Placebo group (N=153) RR or HR (95% CI) 2-year rates 76/155.2 (49.0%/year) 134/151.2 (88.6%/year) 0.55 (0.42, 0.73) P<0.0001 143/237.5 (60.2%/year) 88/2450 (35.9%/year) 1.68 (1.29, 2.19) P=0.0001 All events1 0.63 [0.31, 1.26] P=0.19 3.24 [1.38, 7.59] P=0.004 13 (14.3%) 20 (26.8%) 22 (16.4%) 7 (5.2%) All-cause death2 0.16 [0.02, 1.32] P=0.051 1 (1.5%) 6 (9.0%) 0 (0.0%) 0 (0.0%) - LVAD/HT2 41/155.2 (26.0%/year) 78/151.2 (52.0%/year) 0.52 [0.31, 0.86] P=0.01 87/237.5 (37.0%/year) 47/245.0 (19.0%/year) 2.05 [1.35, 3.10] P=0.0008 All HFHs1,3 21/155.2 (14.0%/year) 30/151.2 (20.0%/year) 0.70 [0.39, 1.23] P=0.21 34/237.5 (14.0%/year) 34/245.0 (14.0%/year) 1.04 [0.64, 1.68] P=0.88 All out-pt WHFs1,3 1Total no. of events/total no. of patient-years of follow-up (annualized rate) with relative rate ratio (95% CI) 2Time-to-first event analysis n events (Kaplan-Meier estimated rate) with HR (95% CI) from a Cox model 3HR (95% CI) from a joint frailty model accounting for the competing risk of death
Risk of Cardiovascular Events by LVEF LVEF >40% HR or RRR [95% CI] LVEF 40% HR or RRR [95% CI] Hazard ratio or relative rate ratio [95% CI] P-value for interaction All-cause death through 2 years,time to first 0.63 [0.31, 1.26] 3.24 [1.38, 7.59] 0.0036 HT or LVAD implantation through 2 years,time to first 0.16 [0.02. 1.32] - - Heart failure hospitalizations (HFHs), all through 2 years no. of events/total no. of pt-yr (annualized rate), JF model 0.52 [0.31, 0.86] 2.05 [1.35, 3.10] <0.0001 Outpatient worsening HF events, all through 2 years no. of events/total no. of pt-yr (annualized rate), JF model 0.70 [0.39, 1.23] 1.04 [0.64, 1.68] 0.27 All-cause death or HT or LVAD implantation through 2 years,time to first 0.52 [0.27, 1.00] 3.24 [1.38, 7.59] 0.0008 All-cause death, HT or LVAD, and HFHs, all events through 2 years no. of events/total no. of patient-yr-yr (annualized rate) 0.52 [0.37, 0.71]* 2.08 [1.50, 2.88]* <0.0001 All-cause death, HT or LVAD, HFH and outpatient worsening HF events, all through 2 years no. of events/total no. of patient-yr (annualized rate) 0.55 [0.42, 0.73]* 1.68 [1.29, 2.19]* <0.0001 *RRR (otherwise HR)
Risk of all Cardiovascular Events by LVEF - All-cause death, LVAD/HT, all HFHs, and all out-patient worsening HF events - Shunt minus control arm event rate difference LVEF (%)
Change in KCCQ-OSS Over Time by LVEF LVEF 40% (n=206) LVEF >40% (n=302) Change from baseline through 1 year 12.2 20.5 vs. 11.4 20.5, P=0.89 Change from baseline through 1 year 7.4 22.1 vs. 9.4 21.8, P=0.51
Limitations 1. The present results apply only to the profile of the pts enrolled and treated with the Ventura inter-atrial shunt 2. The reduced and preserved LVEF groups, although pre-specified randomized strata, were not individually powered for effectiveness; the results within each strata must therefore be considered exploratory However, the strong interaction (P<0.0001) and spline curve analysis for cardiovascular events suggests these findings are not due to play of chance 3. The large and similar increase in KCCQ-OSS in both the device and control groups emphasizes the relevance of the placebo effect and the necessity for blinded trials Moreover, the similar magnitude of KCCQ-OSS improvement and the lack of between-group differences in this metric despite a large decrease in HFHs in shunt-treated pts with reduced LVEF and a large increase in HFHs and mortality in shunt-treated pts with preserved LVEF confounds its interpretation in blinded (and open-label) trials
Conclusions Transcatheter implantation of the Ventura inter-atrial shunt was safe but did not reduce symptoms or improve prognosis through 2 years in patients with HF across the full range of all LVEF The results from a pre-specified stratified analysis suggest that inter-atrial shunt implantation is beneficial in patients with reduced LVEF and harmful in patients with preserved LVEF
