Developments in the Floating Wind Market: Insights and Projections
Exploring the maturation of the floating wind market through historical milestones, current projects in Europe, global pipeline projections, and timelines for upcoming projects. Insights on costs, supply chain, installation, bankability, and risk considerations contribute to understanding the evolution towards commercial-scale floating wind by 2024.
Download Presentation

Please find below an Image/Link to download the presentation.
The content on the website is provided AS IS for your information and personal use only. It may not be sold, licensed, or shared on other websites without obtaining consent from the author.If you encounter any issues during the download, it is possible that the publisher has removed the file from their server.
You are allowed to download the files provided on this website for personal or commercial use, subject to the condition that they are used lawfully. All files are the property of their respective owners.
The content on the website is provided AS IS for your information and personal use only. It may not be sold, licensed, or shared on other websites without obtaining consent from the author.
E N D
Presentation Transcript
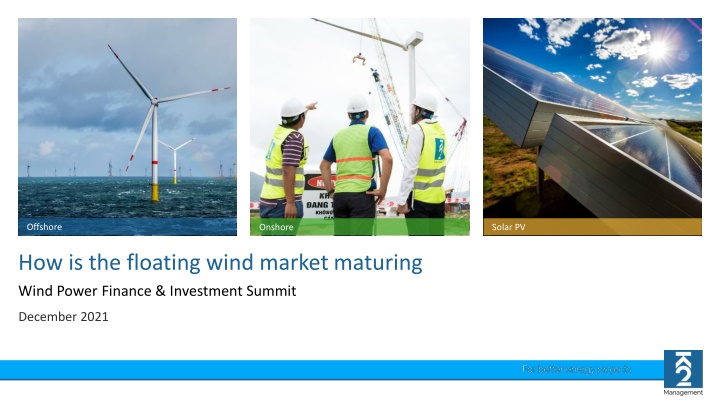
Offshore Onshore Solar PV How is the floating wind market maturing Wind Power Finance & Investment Summit December 2021
Agenda Introduction to floating wind Costs and Supply Chain Installation (Some) Bankability and Risk O&M Considerations Conclusions 18 August 2024 K2 Management Floating Wind Workshop Page 2
Floating Wind: A Brief History 2007 World s first floating wind turbine (Blue H Tech Italy) 2009 Hywind 2MW Demo (Equinor Norway) 2011 Windfloat 2MW Prototype (Principle Power Portugal) 2017 First floating wind farm (Equinor - Hywind Scotland 30MW) 2020 Windfloat Atlantic (Principle Power 25MW) Towards commercial scale floating wind 18 August 2024 K2 Management Floating Wind Workshop Page 4
Current & Future Projects - Europe Project Country Size WTGs Foundations Online 5x SGRE SG-154 6MW Spar (Equinor) Hywind Scotland Scotland 30MW 2017 3x MVOW V164- 8MW Semi-Submersible (Principle Power) Windfloat Atlantic Portugal 25MW 2019 5x MVOW V164-9.5MW Semi-Submersible (Navantia-Windar) Kincardine Scotland 48MW 2021 11x SGRE SG-167 8MW Spar (Equinor) Hywind Tampen Norway 88MW 2022 Semi Submersible SAPIEM? AFLOWT Ireland 6MW 1 x ^MW 2022 3x MVOW V164-10MW Barge (Ideol) Eolmed France 30MW 2022 3x MVOW V164-9.5MW Semi-Submersible (Naval Energies) Groix et Belle-Ile France 28.5MW 2022 3x MVOW V164-10MW Semi-Submersible (Principle Power) Golfe du Lion France 30MW 2023 Provence Grand Large 3x SGRE SG-154 8MW Tension Leg (SBM/IFPEN) France 25.2MW 2023 18 August 2024 K2 Management Floating Wind Workshop Page 5
Global Pipeline 35GW CAGR =43.6% The total global floating offshore wind 30GW Hawaii Oregon capacity is expected to reach was 29 GW at Portugal Greece 25GW the end of 2035, based on projects that have Taiwan Maine 20GW Italy Spain announcedtheirplanned capacity. Norway Ireland 15GW 13.5 GW of floating offshore wind is expected Japan China UnitedKingdom France 10GW to be constructed in Europe, with France and California SouthKorea the UK being the major markets by 2035. 5GW South Korea will lead the Asian market (9.8 0GW GW) and California will be the front-runner in 2021 2020 2025 2029 2026 2023 2024 2028 2022 2031 2033 2027 2030 2032 2035 2034 North America (5.5 GW). Offshore Construction Start Year The primary driver for pipeline expansion is Floating wind market by 2035 the movement toward commercial-scale 5.5 GW projectsdevelopinginAsia. Europe 13.5 GW 29 GW Asia North America 9.8 GW
Timeline for Projects with Announced CODs There are roughly 14 projects (297 MW) that are under construction or in the permitting phase in Europe, which are scheduled for commercial operations between 2020 and 2024. There are 7 GW of projects in early planning phase phase globally (1.6 GW in Europe, 4.7 GW in Asia, 700 MW in North America). Not included: projects announced without an Italy anticipatedCOD UPDATE Currently France is looking to grant 1500MW of additionalcapacity Source: NREL
Country-Specific Capacity Based on Announced COD Through 2025 1.2GW The floating wind market will increase CAGR =54.2% 10-fold (CAGR=54.2%) in the next five Portugal Maine 1.0GW years from 0.13 GW to 1 GW. Spain Norway 0.8GW Ireland Japan South Korea, France, Taiwan, Spain, China UnitedKingdom and the UK account for the majority of 0.6GW France South Korea announced CODs through 2025, with several commercial-scale projects 0.4GW announced for 2024. 0.2GW Pilot-scale projects (less than 50 MW) account for nearly all floating projects 0.0GW 2020 2024 2025 with announced CODs through 2023. 2023 2021 2022 Offshore Construction Start Year
Global Floating Substructure Market Share Global Global cumulative installed capacity by architecture, cumulative installed capacity by architecture, 2020 2020- -2035 2035 In 2020, there were 29 GW of projects in the floating pipeline; the substructure type is announced for roughly 22% (6,362 WindFloat TetraSpar Hywind Hexicon 2,385MW MW) of the total pipeline. 1,558MW 1,370MW Semisubmersibles account for about 53% of installed and 710MW announced capacity for projects which the intended 4-columnsemi-sub DampingPool Inclined-TLP Naval Energies 206MW 35MW 25MW 29MW 21MW 12MW 10MW 2MW substructure type is known. Approximately 46% use or plan to use spars (e.g., Equinor s Nezzy 30-MW floating wind power plant). VolturnUs OO-Star SATH The remaining substructures are tension-leg platforms and barges. *Note:Capacityisbasedonknownproject pipeline
Why Floating? Where is it Suitable? Floating vs. conventional offshore wind systems: CAPEX estimates with water depth Floating foundations give access to deeper waters New markets Less constrained sites Higher and more consistent wind speeds Transition depth between fixed and floating is still to be determined Monopiles: Currently up to ~40m 40-60m+ in the future Jackets: Limited to specific sites. Currently up to ~70m 70-100m in the future? Projections depend heavily on the assumed cost reductions in floating wind 18 August 2024 K2 Management Floating Wind Workshop Page 10
Fixed vs Floating Foundations Fixed Floating Maturity Mature industry Mostly pre-commercial 2x dominant concepts (monopiles & jackets) Concepts Many different concepts Many design houses & consultancies Mostly patent-free Designed by specialised OEMs (to date) Key innovations patented Design Materials Usually steel Steel or concrete (+ballast) Generally lighter Size increases with water depth Larger footprint & heavier Size doesn t depend on water depth Size / Weight Monopiles highly automated Jackets more complex but well understood Fabrication Complex fabrication and long lead-times Offshore Jack-up vessels WTG Installation Quayside FOU Installation Jack-up vessels Mostly smaller vessels 18 August 2024 K2 Management Floating Wind Workshop Page 11
Costs & Supply Chain 18 August 2024 K2 Management Floating Wind Workshop Page 12
Bid / Subsidy Evolution 2018-2025 The major contributor has been the introduction of larger WTGs +8MW Major developers have changed their operating platforms from a project by project to a portfolio approach. Synergy effects Partnering Collaborative cost outs in all areas of the supply chain One park fits all (industrialization and simplification) Upsides such as lifetime extension have also played a significant part. 18 August 2024 K2 Management Floating Wind Workshop Page 13
WTG Trends 2025-2030 WTG size will continue to grow Therefore either the site capacity will be met with fewer turbines or site capacity will grow. Currently the trend is that both WTG size and site capacity aspects increase K2M 2030 Offshore WTG market projection High values inblue, low values in green and average as dottedline. 18 August 2024 K2 Management Floating Wind Workshop Page 14
Cost Breakdown: Floating vs Fixed Internal K2M cost estimations 18 August 2024 K2 Management Floating Wind Workshop Page 15
Potential LCOE Reductions IEA Wind projections IWind Europe Floating projections 18 August 2024 K2 Management Floating Wind Workshop Page 16
Bankability and Risk 18 August 2024 K2 Management Floating Wind Workshop Page 17
Contract Structures Current Projects have employed limited multi-contract structures. Contract interfaces can differ from fixed bottom offshore wind. Installation methods/requirements also change contract focus. Typical Package Breakdown TSA and Installation (on the substructure at a quayside or inshore) Substructure Fabrication Substructure design Mooring system design Mooring system installation Substructure/WTG tow-out and and hook up Electrical BoP (so far no floating OSPs have been deployed but that will come) Various permutations and bundling of these packages can be made to tailor risk exposure. 18 August 2024 K2 Management Floating Wind Workshop Page 18
Interface Management Floating technology and methods/sequencing of installation activities introduce interface management challenges WTG/Substructure system interaction System level analysis at the design phase Point of transfer of title Efficient interfacing of commissioning activities Operational responsibility for defects due to floating system Commercial Interfaces Warranties and carve outs, especially in the TSA. Construction sequencing/knock on delays etc. ToC and takeover considerations. 18 August 2024 K2 Management Floating Wind Workshop Page 19
Risk Management New risks associated with the floating technology must be considered and managed throughout the project lifecycle. Fundamentally different failure modes to consider. Typically more challenging conditions due to locations (further offshore, deeper water, more restrictive weather conditions). QRA, Insurance and downside sensitivity analysis will be key to lender DD processes. Consideration of contingency during the LTA phase will follow the same process. 18 August 2024 K2 Management Floating Wind Workshop Page 20
Bankability Considerations Floating offshore wind combines existing experience from offshore wind and floating oil & gas. The technology is not new, only the application. Design and certification processes are still relatively immature so require additional scrutiny. Commercial interfaces and warranty gaps are still open in some key areas. Debt sizing and DSCR thresholds will differ from current offshore wind financing due to project cost structure and risk exposure. 18 August 2024 K2 Management Floating Wind Workshop Page 21
Thank you for listening... 18 August 2024 18 August 2024 K2 Management Floating Wind Workshop Page 22
