Development of Microstructure in Lead-Tin Eutectic Alloys
Different microstructures can form in lead-tin eutectic alloys, based on composition and cooling rate. The article explores various scenarios of solidification in lead-tin systems, highlighting the phases and structures that evolve at different compositions and temperatures. It discusses the phases formed during slow cooling from liquid phase regions, detailing the microstructural changes and compositions as the alloys solidify. The analysis covers a range of lead and tin compositions, illustrating the equilibrium microstructures that result from cooling lead-tin alloys.

Download Presentation

Please find below an Image/Link to download the presentation.
The content on the website is provided AS IS for your information and personal use only. It may not be sold, licensed, or shared on other websites without obtaining consent from the author.If you encounter any issues during the download, it is possible that the publisher has removed the file from their server.
You are allowed to download the files provided on this website for personal or commercial use, subject to the condition that they are used lawfully. All files are the property of their respective owners.
The content on the website is provided AS IS for your information and personal use only. It may not be sold, licensed, or shared on other websites without obtaining consent from the author.
E N D
Presentation Transcript
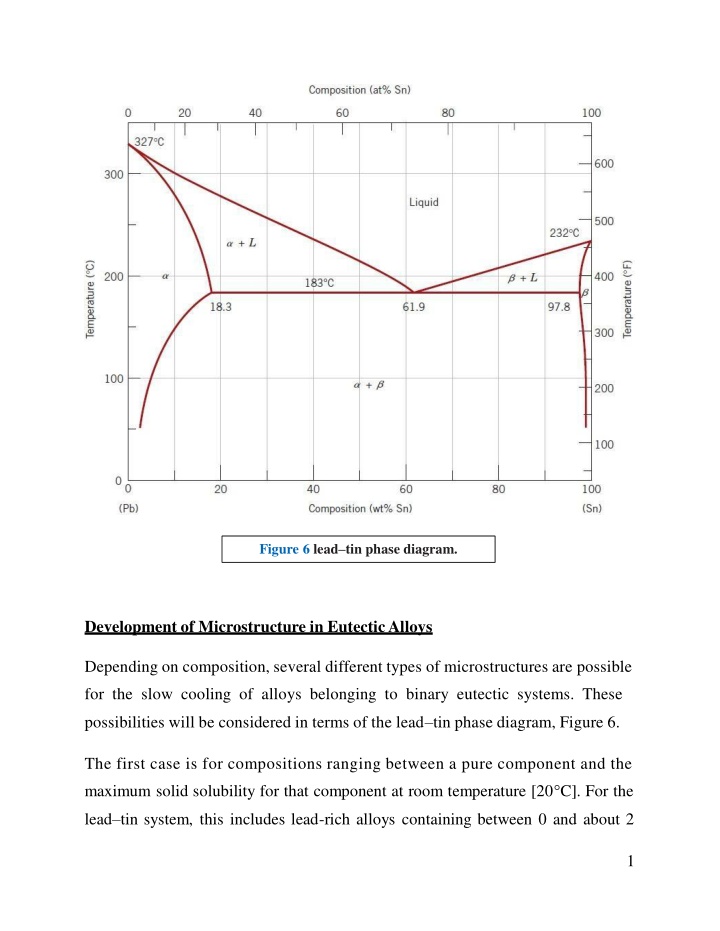
Figure 6 leadtin phase diagram. Development of Microstructure in Eutectic Alloys Depending on composition, several different types of microstructures are possible for the slow cooling of alloys belonging to binary eutectic systems. These possibilities will be considered in terms of the lead tin phase diagram, Figure 6. The first case is for compositions ranging between a pure component and the maximum solid solubility for that component at room temperature [20 C]. For the lead tin system, this includes lead-rich alloys containing between 0 and about 2 1
wt% Sn (for the -phase solid solution) and also between approximately 99 wt% Sn and pure tin (for the phase). For For example, consider an alloy of composition C1(Figure 7) as it is slowly cooled from a temperature within the liquid-phase region, say, 350 C; this corresponds to moving down the dashed vertical line ww in the figure. The alloy remains totally liquid and of composition C1until we cross the liquidus line at approximately 330 C, at which time the solid phase begins to form. While passing through this narrow +L phase region, solidification proceeds in the same manner as was described for the copper nickel alloy; that is, with continued cooling, more of the solid forms. Furthermore, liquid- and solid-phase compositions are different, which follow along the liquidus and solidus phase boundaries, respectively. Solidification reaches completion at the point where ww crosses the solidus line. The resulting alloy is polycrystalline with a uniform composition of C1, and no subsequent changes will occur upon cooling to room temperature. This microstructure is represented schematically by the inset at point c in Figure 7. 2
Figure 7 Schematic representations of the equilibrium microstructures for a lead tin alloy of composition C1 as it is cooled from the liquid- phase region. The second case considered is for compositions that range between the room temperature solubility limit and the maximum solid solubility at the eutectic temperature. For the lead tin system, these compositions extend from about 2 to 18.3 wt% Sn (for lead-rich alloys) and from 97.8 to approximately 99 wt% Sn (for tin-rich alloys). Let us examine an alloy of composition C2as it is cooled along the vertical line xx in Figure 8. Down to the intersection of xx and the solvus line, changes that occur are similar to the previous case as we pass through the corresponding phase regions (as demonstrated by the insets at points d, e, and f ). Just above the solvus intersection, point f, the microstructure consists of grains of composition C2. Upon crossing the solvus line, the solid solubility is exceeded, 3
which results in the formation of small -phase particles; these are indicated in the microstructure inset at point g. With continued cooling, these particles will grow in size because the mass fraction of the phase increases slightly with decreasing temperature. Figure 8 Schematic representations of the equilibrium microstructures for a lead tin alloy of composition C2 as it is cooled from the liquid- phase region. The third case involves solidification of the eutectic composition, 61.9 wt% Sn (C3 in Figure 9). Consider an alloy having this composition that is cooled from a temperature within the liquid-phase region (e.g., 250 C) down the vertical line yy in Figure 9. As the temperature is lowered, no changes occur until we reach the eutectic temperature, 183 C. Upon crossing the eutectic isotherm, the liquid 4
transforms into the two and phases. This transformation may be represented by the reaction in which the - and -phase compositions are dictated by the eutectic isotherm end points. Figure 9 Schematic representations of the equilibrium microstructures for a lead tin alloy of eutectic composition C3 above and below the eutectic temperature. During this transformation, there must be a redistribution of the lead and tin components because the and phases have different compositions, neither of which is the same as that of the liquid (as indicated in the above reaction).This redistribution is accomplished by atomic diffusion. The microstructure of the solid 5
that results from this transformation consists of alternating layers (sometimes called lamellae) of the and phases that form simultaneously during the transformation. This microstructure, represented schematically in Figure 9, in point (i), is called a eutectic structure and is characteristic of this reaction.A photomicrograph of this structure for the lead tin eutectic is shown in Figure 10. Subsequent cooling of the alloy from just below the eutectic to room temperature will result in only minor microstructural alterations. The microstructural change that accompanies this eutectic transformation is represented schematically in Figure 11, which shows the - layered eutectic growing into and replacing the liquid phase. The process of the redistribution of lead and tin occurs by diffusion in the liquid just ahead of the eutectic liquid interface. The arrows indicate the directions of diffusion of lead and tin atoms; lead atoms diffuse toward the -phase layers because this phase is lead rich (18.3 wt% 6
Sn81.7 wt% Pb); conversely, the direction of diffusion of tin is in the direction of the , tin-rich (97.8 wt% Sn 2.2 wt% Pb) layers. The eutectic structure forms in these alternating layers because, for this lamellar configuration, atomic diffusion of lead and tin need occur over only relatively short distances. The fourth and final microstructural case for this system includes all compositions other than the eutectic that, when cooled, cross the eutectic isotherm. Consider, for example, the composition C4in Figure 12, which lies to the left of the eutectic; as the temperature is lowered, we move down the line zz , beginning at point j. The microstructural development between points j and l is similar to that for the second case, such that just prior to crossing the eutectic isotherm (point l), the and liquid phases are present with compositions of approximately 18.3 and 61.9 wt% Sn, respectively, as determined from the appropriate tie line.As the temperature is lowered to just below the eutectic, the liquid phase, which is of the eutectic composition, will transform into the eutectic structure (i.e., alternating and lamellae); insignificant changes will occur with the phase that formed during cooling through the +L region. This microstructure is represented schematically by the inset at point m in Figure 12. Thus, the phase will be present both in the eutectic structure and also as the phase that formed while cooling through the +L phase field. To distinguish one from the other, that which resides in the eutectic structure is called eutectic , whereas the other that formed prior to crossing the eutectic isotherm is termed primary ; both are labeled in Figure 12.The photomicrograph in Figure 13 is of a lead tin alloy in which both primary and eutectic structures are shown. 7

 and also between")


; conversely, the direction of diffusion of")