Developing Network Models of Industrial Symbiosis - A Comprehensive Overview
Exploring the concept of Industrial Symbiosis (IS) and its significance in waste management solutions through physical material exchange and collaboration. The possibilities and linkages in CO2 network allocation and input-output analyses for Ammonia and Methanol plants are discussed, shedding light on the potential for sustainable industrial practices.
Download Presentation

Please find below an Image/Link to download the presentation.
The content on the website is provided AS IS for your information and personal use only. It may not be sold, licensed, or shared on other websites without obtaining consent from the author.If you encounter any issues during the download, it is possible that the publisher has removed the file from their server.
You are allowed to download the files provided on this website for personal or commercial use, subject to the condition that they are used lawfully. All files are the property of their respective owners.
The content on the website is provided AS IS for your information and personal use only. It may not be sold, licensed, or shared on other websites without obtaining consent from the author.
E N D
Presentation Transcript
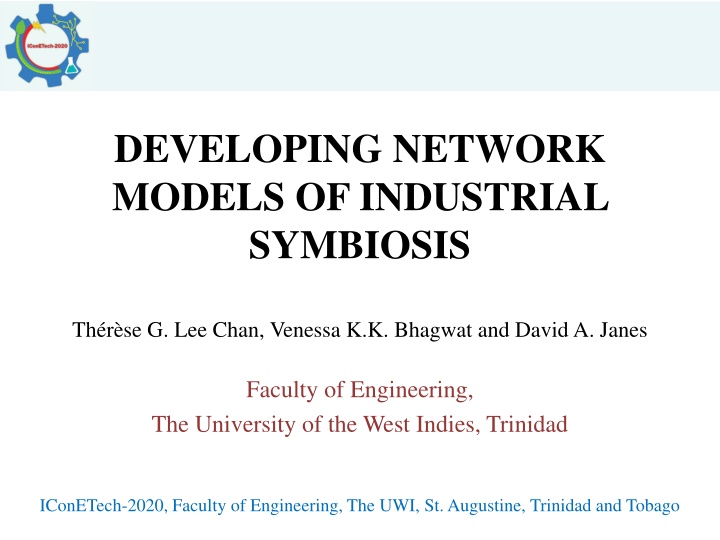
DEVELOPING NETWORK MODELS OF INDUSTRIAL SYMBIOSIS Th r se G. Lee Chan, Venessa K.K. Bhagwat and David A. Janes Faculty of Engineering, The University of the West Indies, Trinidad IConETech-2020, Faculty of Engineering, The UWI, St. Augustine, Trinidad and Tobago
Industrial Symbiosis (IS) Physical material exchange Waste management solution Collaboration Geographic proximity Example of an Eco-Industrial Park (EIP) Source: Nagilmer (2013)
Measurement of IS Connectance and Symbiotic Utilisation (Hardy and Graedel, 2008) Waste Recycling Rate (Tiejun, 2010; Gao et al., 2013) Environmental Impact Momentum (Felicio et al., 2016)
Why Carbon Dioxide (CO2)? Greenhouse gas emission High emissions from petrochemical industry Creation of valuable products Plant in the Point Lisas Industrial Estate (PLIE) (Source: PLNL, 2020)
Possible CO2 Network Linkages Sources Sinks M1 A1 M2 A2 M3 M4 W Key: A ammonia plant; M methanol plant; W waste
CO2 Network Figure 1: Optimal CO2 allocation (t/y) for simple transportation- problem example. Key: A ammonia plant; M methanol plant; W waste.
Possible CO2 Network Linkages Sources Sinks A1 M1 A2 M2 A3 M3 A4 U A5 W Key: A ammonia plant; M methanol plant; U- urea plant; W waste
Input-Output Analysis for Ammonia Energy 2250 GJ/h 123 t/h Steam 78 t/h Ammonia Ammonia Plant 30 t/h Nat. Gas 95 t/h Carbon Dioxide 80 t/h Air 54 t/h Exhaust Gas (Carbon Dioxide only) Ammonia Enterprise Input-Output (EIO)
Input-Output Analysis for Methanol Energy 1830 GJ/h 40 t/h Water Methanol Plant 59 t/h 46 t/h Natural Gas Methanol 18 t/h Carbon Dioxide 30 t/h Exhaust Gas (Carbon Dioxide only) Methanol EIO
IS Assessment Table 1: IS Performance Indicators IS Indicator Base Current Eco-connectance 0 1.32 Environmental impact momentum 0 0.21 Fraction of waste CO2 utilized 0 0.17
CO2 Network Optimisation Waste CO2 Single Objective Cost Optimisation Multi- Objective (MOO) Waste CO2 and Cost Linear Programming (LP) and Mixed-Integer Linear Programming (MILP)
MOO MILP CO2 Network (Current Case) Waste CO2: 345 t/h CO2 Transportation: $11.4 M Figure 2: Optimal network for current case showing inter-plant CO2 flows (kg/h). Key: A, M & W see Fig. 1; U urea plant
Addition of a CO2 Reuse Plant Sources Sinks A1 M1 A2 M2 M3 A3 U A4 A5 P W Key: A ammonia plant; M methanol plant; U- urea; P propylene carbonate plant; W waste
MOO MILP CO2 Network (Proposed Case) Waste CO2: 340 t/h CO2 Transportation: $13.6 M Figure 3: Optimal network for current case showing inter-plant CO2 flows (kg/h). Key: A, M & W see Fig. 1; P propylene carbonate plant
IS Assessment Table 2: IS Performance Indicators IS Indicator Current Proposed Eco-connectance 1.33 1.80 Environmental impact momentum 0.21 0.22 Fraction of waste CO2 utilized 0.17 0.18
Three Pillars of Sustainability Table 3: Sustainability Indicators Sustainability Dimension Indicator Current Proposed EnvironmentalEco-efficiency 10 17 9.5 18 Relative change of CO2 recycling (%) Capital Investment in New Plant (million $) Profit as a result of IS activities (million $/y) Job Creation Creation of Industrial Symbiosis - 17.2 Economic 3.5 (3.7+3.6) No 4 Yes 5 Social
Conclusions Linearized EIO models with process simulation data can be used to analyse and optimise potential IS scenarios PLIE has some characteristics of an EIP There is plenty of high-purity CO2 available for reuse on PLIE Introducing a new CO2-reuse plant into the network decreased CO2 emissions by 1%. Adding CO2-reuse plants should lead to higher IS indicator values and further triple-bottom-line benefits
References [1] D.M. Yazan, V.A. Romano, V. Albino. The design of industrial symbiosis: an input output approach. Journal of Cleaner Production no. 129, (2016) 537-547. [2] C.A. Boyle, B.W. Baetz. A prototype knowledge-based decision support system for industrial waste management: Part II. Application to a Trinidadian industrial estate case study. Waste Management 17 no. 7, (1998) 411-428. [3] J. Ehrenfeld, N. Gertler. Industrial Ecology in Practice: The Evolution of Interdependence at Kalundborg. Journal of Industrial Ecology no. 1, (1997) 67 79. [4] D. Boodlal. 2008. Trinidad and Tobago's CO2 Inventory and Techno-economic Evaluation of Carbon Capture Options for Emission Mitigation. 3rd Tobago Gas Technology Conference, Lowlands, Tobago. [5] D. Tiejun, Two quantitative indices for the planning and evaluation of eco-industrial parks. Resources, Conservation and Recycling 54 no. 7, (2010) 442-448. [6] H.S. Park, S.K. Behera. Methodological aspects of applying eco-efficiency indicators to industrial symbiosis networks. Journal of Cleaner Production no. 64, (2014) 478-485. [7] O. Yilmaz, E. Yontem, E. Alkaya. 2016. Industrial Symbiosis Indicators. FISSAC. [8] L. Fraccascia, V. Albino, C. A. Garavelli. Technical efficiency measures of industrial symbiosis networks using enterprise input- output analysis. International Journal of Production Economics no.183, (2017) 273-286. [9] L. Gao, M. Fang, H. Li, J. Hetland. Cost analysis of CO2 transportation: Case study in China. Energy Procedia no.4, (2011) 5974- 5981. [10] S.K. Benn-Ogeer, D.A. Janes, R. Deo. A Life Cycle Assessment (LCA) of the Production of Biofuels in Trinidad from Waste CO2 with Microalgae, e-Journal of the Caribbean Academy of Sciences 8 no. 1, (2015). [11] Y. Demirel. Sustainability and Economic Analysis of Propylene Carbonate and Polypropylene Carbonate Production Processes Using CO2 and Propylene Oxide. Chemical Engineering & Process Technology 6 no. 3, (2015) 236-243. [12] N. von der Assen, A. Bardow. Life cycle assessment of polyols for polyurethane production using CO2 as feedstock: insights from an industrial case study. Green Chemistry no.16, (2014) 3272-3280. [13] S.T. McCoy, E. S. Rubin. An engineering-economic model of pipeline transport of CO2 with application to carbon capture and storage. International Journal of Greenhouse Gas Control 2 no. 2, (2008) 219-229. [14] E.E. Williams, 1970. The Future of the Caribbean. In From Columbus to Castro: The History of the Caribbean, 1492 1969. Harper and Row. [15] C. Hardy, T.Graedel. Industrial Ecosystems as Food Webs. Journal of Industrial Ecology no. 6, (2008) 29 - 38. [16] M. Felicio, D. Amaral, K. Esposto, X. Gabarrell Durany. Industrial symbiosis indicators to manage eco-industrial parks as dynamic systems. Journal of Cleaner Production no. 118, (2016) 54-64.
THANK YOU! IConETech-2020, Faculty of Engineering, The UWI, St. Augustine, Trinidad and Tobago
