Data Analysis for Game Development

 undefined
I
n
t
r
o
d
u
c
t
i
o
n
IMGD 2905


B
r
e
a
k
o
u
t
1
•
What is data analysis for game
development?
•
Where does this data come from?
•
What can game analysis do for
game development?
•
Icebreaker, Groupwork, Questions

W
h
a
t
i
s
d
a
t
a
a
n
a
l
y
s
i
s
f
o
r
g
a
m
e
d
e
v
e
l
o
p
m
e
n
t
?
W
h
a
t
i
s
d
a
t
a
a
n
a
l
y
s
i
s
f
o
r
g
a
m
e
d
e
v
e
l
o
p
m
e
n
t
?
•
Using
game data
to inform the
game development
process
•
Where does this data come
from?
Players
, actually
playing game
‒
Quantitative
(instrumented)
‒
Qualitative
(subjective
evaluation)
‒
(But often lots more of former!)
W
h
a
t
i
s
d
a
t
a
a
n
a
l
y
s
i
s
f
o
r
g
a
m
e
d
e
v
e
l
o
p
m
e
n
t
?
•
Using
game data
to inform the
game development
process
•
Where does this data come
from?
Players
, actually
playing game
‒
Quantitative
(instrumented)
‒
Qualitative
(subjective
evaluation)
‒
(But often lots more of former!)
W
h
a
t
i
s
d
a
t
a
a
n
a
l
y
s
i
s
f
o
r
g
a
m
e
d
e
v
e
l
o
p
m
e
n
t
?
•
Using
game data
to inform the
game development
process
•
Where does this data come
from?
Players
, actually
playing game
‒
Quantitative
(instrumented)
‒
Qualitative
(subjective
evaluation)
‒
(But often lots more of former!)
W
h
a
t
c
a
n
g
a
m
e
a
n
a
l
y
s
i
s
d
o
f
o
r
g
a
m
e
d
e
v
e
l
o
p
m
e
n
t
?
W
h
a
t
c
a
n
g
a
m
e
a
n
a
l
y
s
i
s
d
o
f
o
r
g
a
m
e
d
e
v
e
l
o
p
m
e
n
t
?
•
Improve level design
– e.g., see
where players are getting stuck
•
Focus development on critical
content
– e.g., see what game
modes or characters are not used
•
Balance gameplay
– e.g., tune
parameters for more competitive
and fun combat
•
Broaden appeal
– e.g., hear if
content/story is engaging or
repulsing
•
Note: game data often informs
players
, too
‒
Analytics not dissimilar
W
h
y
i
s
d
a
t
a
a
n
a
l
y
s
i
s
f
o
r
g
a
m
e
d
e
v
e
l
o
p
m
e
n
t
n
e
e
d
e
d
?
W
h
y
i
s
d
a
t
a
a
n
a
l
y
s
i
s
f
o
r
g
a
m
e
d
e
v
e
l
o
p
m
e
n
t
n
e
e
d
e
d
?
•
Challenge
‒
Games now larger & more
complex
₊
Number of reachable states,
characters
Game balance harder to achieve
‒
Need for metrics to make sense
of player behavior has increased
•
Opportunity
‒
New technologies enable
aggregation, access and analysis
I
M
G
D
2
9
0
5
–
D
o
i
n
g
D
a
t
a
A
n
a
l
y
s
i
s
f
o
r
G
a
m
e
D
e
v
e
l
o
p
m
e
n
t
•
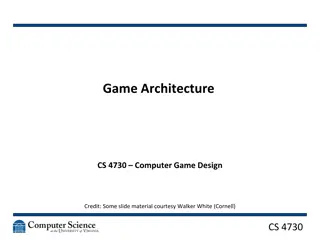
Data analysis pipeline
– get data from
games, through analysis, to
stakeholders
•
Summary statistics
– central
tendencies of data
•
Visualization of data
– how to display
analysis, illustrate messages
•
Statistical tests
– quantitatively
determine relationships (e.g.,
correlation)
‒
Probability needed as foundation (also
used for game rules)
•
Regression – model relationships
•
More advanced topics (e.g.,
ML
,
Data management
…)
For this class:
•
Described
in lecture
•
Discussed
in class
•
Read
about in book
•
Applied
in projects &
homework
F
o
u
n
d
a
t
i
o
n
s
f
o
r
D
a
t
a
A
n
a
l
y
s
i
s
@
W
P
I
•
Statistics classes
‒
MA 2610 Applied Statistics for Life Sciences
‒
MA 2611 Applied Statistics I
‒
MA 2612 Applied Statistics II
•
Probability classes
‒
MA 2621 Probability for Applications
•
Data Science (minor and major)
‒
DS 1010 Introduction to Data Science
‒
DS 2010 Modeling and Data Analysis
‒
DS 3010 Computational Data Intelligence
‒
DS 4433/CS4433 Big Data Management
and Analytics
•
Data Mining
‒
CS 4445 Data Mining and Knowledge
Discovery in Databases
•
Other
‒
CS 1004 Introduction to Programming for
Non-Majors
‒
CS 3431 Database Systems I
Note – other Stats
and Probability
classes geared for
Math majors
O
u
t
l
i
n
e
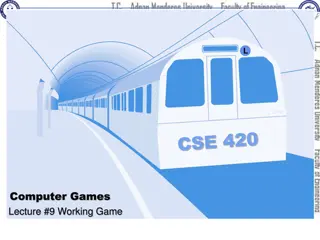
•
Overview
(
done
)
•
Game Analytics Pipeline
(
next
)
•
Examples
S
o
u
r
c
e
s
o
f
G
a
m
e
D
a
t
a
Quantitative
(
Objective
)
•
Internal Testing
-
Developers
-
QA
•
External Testing
-
Usability testing
-
Beta tests
-
Long-term play
data
Qualitative
(
Subjective
)
•
Surveys
•
Reviews
•
Online
communities
•
Postmortems
From
data
to
dissemination
?
Game analytics pipeline
G
a
m
e
A
n
a
l
y
t
i
c
s
P
i
p
e
l
i
n
e
Game
Raw Data
Extracted
Data
Exploratory
Graphs/Stats
Charts and
Tables
Statistical
Tests
Analysis
G
a
m
e
A
n
a
l
y
t
i
c
s
P
i
p
e
l
i
n
e
–
E
x
a
m
p
l
e
Analysis
Proj 3!
G
a
m
e
A
n
a
l
y
t
i
c
s
C
o
m
p
o
n
e
n
t
s
•
Games
– breadth of experience with games,
specific experience with game to be
analyzed
•
Tools
– import, clean, filter, format data so
can analyze
•
Statistics
– measures of central tendency,
measures of spread, statistical tests
•
Probability
– rules, distributions
•
Data Visualization
– bar chart, scatter plot,
histogram, error bars
•
Technical Writing
and
Presentation
– white
paper, technical talk; audience is peer
group, developers, boss
O
u
t
l
i
n
e
•
Overview
(
done
)
•
Game Analytics Pipeline
(
done
)
•
Examples
(
next
)
E
x
a
m
p
l
e
:
P
r
o
j
e
c
t
G
o
t
h
a
m
R
a
c
i
n
g
4
•
Publisher – Microsoft 2007
‒
134 vehicles, 9 locations,
10 game modes
•
Analyzed data
‒
(Authors worked at
Microsoft)
‒
3.1 million log entries,
1000s of users
K. Hullett, N. Nagappan, E. Schuh, and J.
Hopson. “Data Analytics for Game
Development”,
International Conference on
Software Engineering (ICSE
), May, 2011,
Waikiki, Honolulu, HI, USA
http://dl.acm.org/citation.cfm?id=1985952
P
r
o
j
e
c
t
G
o
t
h
a
m
R
a
c
i
n
g
4
:
R
e
s
u
l
t
s
•
Thoughts?
•
What are
some main
messages?
Game Mode Races % Total
OFFLINE_CAREER 1479586 47.63%
PGR_ARCADE 566705 18.24%
NETWORK_PLAY 584201 18.81%
SINGLE_PLAYER_PLAY 185415 5.97%
….
NET_TOURNY_ELIM 2713 0.09%
Group Races % Total
STREET_RACE 795334 25.60%
NET_STREET_RACE 543491 17.50%
ELIMINATION 216042 6.95%
HOTLAP 195949 6.31%
…
TESTTRACK_TIME 7484 0.24%
CAT_N_MOUSE_FREE 3989 0.13%
CAT_N_MOUSE 53 0.00%
P
r
o
j
e
c
t
G
o
t
h
a
m
R
a
c
i
n
g
4
:
R
e
s
u
l
t
s
Game Mode Races % Total
OFFLINE_CAREER 1479586 47.63%
PGR_ARCADE 566705 18.24%
NETWORK_PLAY 584201 18.81%
SINGLE_PLAYER_PLAY 185415 5.97%
….
NET_TOURNY_ELIM 2713 0.09%
Group Races % Total
STREET_RACE 795334 25.60%
NET_STREET_RACE 543491 17.50%
ELIMINATION 216042 6.95%
HOTLAP 195949 6.31%
…
TESTTRACK_TIME 7484 0.24%
CAT_N_MOUSE_FREE 3989 0.13%
CAT_N_MOUSE 53 0.00%
•
Mode
‒
Offline career
dominates
‒
Network
tournament
hardly used
•
Events
‒
Street race
and
network street
race
dominate
‒
Cat and mouse
never used
•
Vehicles
(not
shown)
‒
1/3 used in less
than 0.1% of
races
P
r
o
j
e
c
t
G
o
t
h
a
m
R
a
c
i
n
g
4
:
C
o
n
c
l
u
s
i
o
n
•
Content underused -
30-40%
of
content in less than
1%
of races
•
Use to shift emphases for DLC, next
version
‒
Asset creation costs significant, so
even
25% reduction
noticeable
•
Other (not shown)
‒
Encouraging new players to play
career mode
₊
Increasing likelihood of continuing play
‒
Encouraging new players to stay with
F Class
longer
₊
Rather than move to more difficult to
control
A Class
E
x
a
m
p
l
e
:
H
a
l
o
3
•
Publisher – Microsoft 2007
‒
Achievements: single player
missions, challenges such as
finding skulls, multiplayer
accomplishments…
•
Analyzed data
‒
(Author worked at Microsoft)
‒
18,0000 players
B. Phillips. “Peering into the Black Box of
Player Behavior: The Player Experience
Panel at Microsoft Game Studios”,
Game
Developers Conference (GDC)
, 2010.
http://www.gdcvault.com/play/1012387/P
eering-into-the-Black-Box
H
a
l
o
3
:
R
e
s
u
l
t
s
Thoughts?
Main messages?
H
a
l
o
3
:
R
e
s
u
l
t
s
•
73%
of players
completed
campaign
‒
Can compare
to other Xbox
games
•
Took 26 days to
accomplish
•
Double that
time for all
original content
•
DLC provides
users up to 2
years of content
Good Descriptive Example
E
x
a
m
p
l
e
:
L
e
a
g
u
e
o
f
L
e
g
e
n
d
s
•
Publisher – Riot Games 2009
‒
Rank: ~5 Tiers, 5 divisions
each
25
•
User study (52 players)
‒
Play LoL in controlled
environment
‒
Record objective data
₊
(e.g.,
player rank
and game
stats)
‒
Survey for subjective data
₊
(e.g.,
match balance
and
enjoyment
)
(Mark Claypool), Jonathan Decelle, Gabriel Hall, and
Lindsay O'Donnell. “Surrender at 20? Matchmaking
in League of Legends,” In
IEEE Games, Entertainment,
Media Conference (GEM)
, Toronto, Canada, Oct.
2015.
http://www.cs.wpi.edu/~claypool/papers/lol-matchmaking/
???
L
e
a
g
u
e
o
f
L
e
g
e
n
d
s
:
R
e
s
u
l
t
s
Main messages?
Objective
Main messages?
L
e
a
g
u
e
o
f
L
e
g
e
n
d
s
:
R
e
s
u
l
t
s
Main messages?
Main messages?
Objective
Most teams are balanced
But about 10% more than
3 from mean
Most games evenly matched
But about 5% difference of 2
from mean
L
e
a
g
u
e
o
f
L
e
g
e
n
d
s
:
R
e
s
u
l
t
s
Main
messages?
Main
messages?
Subjective
L
e
a
g
u
e
o
f
L
e
g
e
n
d
s
:
R
e
s
u
l
t
s
Main
messages?
Main
messages?
Subjective
Win?
Game is
balanced
Lose?
Game is
imbalanced
Win?
Game is
fun (70%),
never not fun
Lose?
Game
is almost
never fun
(90%)
L
e
a
g
u
e
o
f
L
e
g
e
n
d
s
:
R
e
s
u
l
t
s
Imbalance in player’s favor the
most
fun!
Matchmaking systems may want to consider - e.g., balance not
so important, so long as player not
always
on imbalanced side
S
u
m
m
a
r
y
•
Data analysis for games
increasingly important
‒
Has potential to improve
game development
•
Knowledge and skills
required
‒
Scripting
‒
Statistics
‒
Data analysis
‒
Writing and
presentation
“Let’s get to it, already!”
-- Tracer (Overwatch)
Exploring the significance of data analysis in game development and how it informs the development process by utilizing player data from quantitative and qualitative sources. Learn what game analysis can achieve and where the data originates to enhance the game development process.

Download Presentation

Please find below an Image/Link to download the presentation.
The content on the website is provided AS IS for your information and personal use only. It may not be sold, licensed, or shared on other websites without obtaining consent from the author.If you encounter any issues during the download, it is possible that the publisher has removed the file from their server.
You are allowed to download the files provided on this website for personal or commercial use, subject to the condition that they are used lawfully. All files are the property of their respective owners.
The content on the website is provided AS IS for your information and personal use only. It may not be sold, licensed, or shared on other websites without obtaining consent from the author.
E N D
Presentation Transcript
Introduction Introduction IMGD 2905
Breakout 1 Breakout 1 What is data analysis for game development? Where does this data come from? What can game analysis do for game development? Icebreaker, Groupwork, Questions https://web.cs.wpi.edu/~imgd2905/d20/breakout/ breakout-1.html
What is data analysis for What is data analysis for game development? game development? https://cdn2.iconfinder.com/data/icons/s ports-and-games-5-1/48/216-512.png
What is data analysis for What is data analysis for game development? game development? https://cdn2.iconfinder.com/data/icons/s ports-and-games-5-1/48/216-512.png Using game data to inform the game development process Where does this data come from? Players, actually playing game Quantitative (instrumented) Qualitative (subjective evaluation) (But often lots more of former!)
What is data analysis for What is data analysis for game development? game development? https://cdn2.iconfinder.com/data/icons/s ports-and-games-5-1/48/216-512.png Using game data to inform the game development process Where does this data come from? Players, actually playing game Quantitative (instrumented) Qualitative (subjective evaluation) (But often lots more of former!)
What is data analysis for What is data analysis for game development? game development? https://cdn2.iconfinder.com/data/icons/s ports-and-games-5-1/48/216-512.png Using game data to inform the game development process Where does this data come from? Players, actually playing game Quantitative (instrumented) Qualitative (subjective evaluation) (But often lots more of former!)
What can game analysis do What can game analysis do for game development? for game development?
What can game analysis do What can game analysis do for game development? for game development? Improve level design e.g., see where players are getting stuck Focus development on critical content e.g., see what game modes or characters are not used Balance gameplay e.g., tune parameters for more competitive and fun combat Broaden appeal e.g., hear if content/story is engaging or repulsing Note: game data often informs players, too Analytics not dissimilar
Why is data analysis for game Why is data analysis for game development needed? development needed?
Why is data analysis for game Why is data analysis for game development needed? development needed? Challenge Games now larger & more complex Number of reachable states, characters Game balance harder to achieve Need for metrics to make sense of player behavior has increased Opportunity New technologies enable aggregation, access and analysis
IMGD 2905 IMGD 2905 Doing Data Analysis for Game Development Analysis for Game Development Data analysis pipeline get data from games, through analysis, to stakeholders Summary statistics central tendencies of data Visualization of data how to display analysis, illustrate messages Statistical tests quantitatively determine relationships (e.g., correlation) Probability needed as foundation (also used for game rules) Regression model relationships More advanced topics (e.g., ML, Data management ) Doing Data For this class: Described in lecture Discussed in class Read about in book Applied in projects & homework
Foundations for Foundations for Data Analysis @ Data Analysis @ WPI WPI Statistics classes MA 2610 Applied Statistics for Life Sciences MA 2611 Applied Statistics I MA 2612 Applied Statistics II Probability classes MA 2621 Probability for Applications Data Science (minor and major) DS 1010 Introduction to Data Science DS 2010 Modeling and Data Analysis DS 3010 Computational Data Intelligence DS 4433/CS4433 Big Data Management and Analytics Data Mining CS 4445 Data Mining and Knowledge Discovery in Databases Other CS 1004 Introduction to Programming for Non-Majors CS 3431 Database Systems I Note other Stats and Probability classes geared for Math majors
Outline Outline Overview Game Analytics Pipeline (next) Examples (done)
Sources of Game Data Sources of Game Data https://tinyurl.com/y3gaja4j Quantitative (Objective) Internal Testing - Developers - QA External Testing - Usability testing - Beta tests - Long-term play data Qualitative (Subjective) Surveys Reviews Online communities Postmortems From data to dissemination? Game analytics pipeline
Game Analytics Game Analytics Pipeline Pipeline Game Analysis Exploratory Graphs/Stats Raw Data Statistical Tests Charts and Tables Extracted Data Dissemination Report Presentation
Game Analytics Game Analytics Pipeline Pipeline Example Example Track-o-Bot Analysis Dissemination Proj 3!
Game Analytics Game Analytics Components Components Games breadth of experience with games, specific experience with game to be analyzed Tools import, clean, filter, format data so can analyze Statistics measures of central tendency, measures of spread, statistical tests Probability rules, distributions Data Visualization bar chart, scatter plot, histogram, error bars Technical Writing and Presentation white paper, technical talk; audience is peer group, developers, boss
Outline Outline Overview Game Analytics Pipeline (done) Examples (done) (next)
Example: Example: Project Gotham Racing 4 Project Gotham Racing 4 K. Hullett, N. Nagappan, E. Schuh, and J. Hopson. Data Analytics for Game Development , International Conference on Software Engineering (ICSE), May, 2011, Waikiki, Honolulu, HI, USA http://dl.acm.org/citation.cfm?id=1985952 Publisher Microsoft 2007 134 vehicles, 9 locations, 10 game modes Analyzed data (Authors worked at Microsoft) 3.1 million log entries, 1000s of users
Project Gotham Racing 4: Project Gotham Racing 4: Results Results Thoughts? Game Mode Races % Total OFFLINE_CAREER 1479586 47.63% PGR_ARCADE 566705 18.24% NETWORK_PLAY 584201 18.81% SINGLE_PLAYER_PLAY 185415 5.97% . NET_TOURNY_ELIM 2713 0.09% What are some main messages? Group Races % Total STREET_RACE 795334 25.60% NET_STREET_RACE 543491 17.50% ELIMINATION 216042 6.95% HOTLAP 195949 6.31% TESTTRACK_TIME 7484 0.24% CAT_N_MOUSE_FREE 3989 0.13% CAT_N_MOUSE 53 0.00%
Project Gotham Racing 4: Project Gotham Racing 4: Results Results Game Mode Races % Total OFFLINE_CAREER 1479586 47.63% PGR_ARCADE 566705 18.24% NETWORK_PLAY 584201 18.81% SINGLE_PLAYER_PLAY 185415 5.97% . NET_TOURNY_ELIM 2713 0.09% Mode Offline career dominates Network tournament hardly used Events Street race and network street race dominate Cat and mouse never used Vehicles (not shown) 1/3 used in less than 0.1% of races Group Races % Total STREET_RACE 795334 25.60% NET_STREET_RACE 543491 17.50% ELIMINATION 216042 6.95% HOTLAP 195949 6.31% TESTTRACK_TIME 7484 0.24% CAT_N_MOUSE_FREE 3989 0.13% CAT_N_MOUSE 53 0.00%
Project Gotham Racing 4: Project Gotham Racing 4: Conclusion Conclusion Content underused - 30-40% of content in less than 1% of races Use to shift emphases for DLC, next version Asset creation costs significant, so even 25% reduction noticeable Other (not shown) Encouraging new players to play career mode Increasing likelihood of continuing play Encouraging new players to stay with F Class longer Rather than move to more difficult to control A Class
Example: Example: Halo 3 Halo 3 B. Phillips. Peering into the Black Box of Player Behavior: The Player Experience Panel at Microsoft Game Studios , Game Developers Conference (GDC), 2010. http://www.gdcvault.com/play/1012387/P eering-into-the-Black-Box Publisher Microsoft 2007 Achievements: single player missions, challenges such as finding skulls, multiplayer accomplishments Analyzed data (Author worked at Microsoft) 18,0000 players
Halo 3: Results Halo 3: Results Thoughts? Main messages?
Halo 3: Results Halo 3: Results 73% of players completed campaign Can compare to other Xbox games Took 26 days to accomplish Double that time for all original content DLC provides users up to 2 years of content Good Descriptive Example
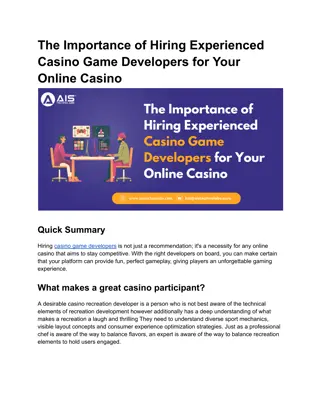
Example: League Example: League of Legends of Legends (Mark Claypool), Jonathan Decelle, Gabriel Hall, and Lindsay O'Donnell. Surrender at 20? Matchmaking in League of Legends, In IEEE Games, Entertainment, Media Conference (GEM), Toronto, Canada, Oct. 2015. http://www.cs.wpi.edu/~claypool/papers/lol-matchmaking/ Publisher Riot Games 2009 Rank: ~5 Tiers, 5 divisions each 25 User study (52 players) Play LoL in controlled environment Record objective data (e.g., player rank and game stats) Survey for subjective data (e.g., match balance and enjoyment) ??? Fun Sweet spot Too hard! Just right! Too easy! Game Balance
League of Legends: League of Legends: Results Results Main messages? Objective Main messages?
League of Legends: League of Legends: Results Results Main messages? Most teams are balanced But about 10% more than 3 from mean Objective Main messages? Most games evenly matched But about 5% difference of 2 from mean
League of Legends: League of Legends: Results Results Main messages? Subjective Main messages?
League of Legends: League of Legends: Results Results Main messages? Win? Game is balanced Lose? Game is imbalanced Subjective Main messages? Win? Game is fun (70%), never not fun Lose? Game is almost never fun (90%)
League of Legends: League of Legends: Results Results Fun Sweet spot Game Balance Sweet spot? Fun Game Balance Imbalance in player s favor the most fun! Matchmaking systems may want to consider - e.g., balance not so important, so long as player not always on imbalanced side
Summary Summary Data analysis for games increasingly important Has potential to improve game development Knowledge and skills required Scripting Statistics Data analysis Writing and presentation https://1kabswnt2ua3ivl0cuqv2f17-wpengine.netdna- ssl.com/wp-content/uploads/2014/06/Skills.jpg Let s get to it, already! -- Tracer (Overwatch)