COSATU 35-Year Gender Review Presentation for Provincial Conferences
This presentation provides an overview of the COSATU Gender Review, focusing on statistical analysis of gender and employment trends from 1985 to 2021, women's leadership statistics in COSATU provinces and affiliates, and key findings from surveys of COSATU affiliates and NGC delegates. It aims to review gender equality achievements, identify gaps and challenges, evaluate policy implementation, and promote active participation in the review process.
Download Presentation

Please find below an Image/Link to download the presentation.
The content on the website is provided AS IS for your information and personal use only. It may not be sold, licensed, or shared on other websites without obtaining consent from the author.If you encounter any issues during the download, it is possible that the publisher has removed the file from their server.
You are allowed to download the files provided on this website for personal or commercial use, subject to the condition that they are used lawfully. All files are the property of their respective owners.
The content on the website is provided AS IS for your information and personal use only. It may not be sold, licensed, or shared on other websites without obtaining consent from the author.
E N D
Presentation Transcript
COSATU 35 year Gender Review PRESENTATION FOR COSATU PROVINCIAL GENDER CONFERENCES
Overview of Presentation Introduction: COSATU Gender Review objectives, methods and key focus areas Outstanding data needed for completion This presentation focuses on the statistical aspects of the gender review report including data from Statistics South Africa, Survey of COSATU Affiliates and Provinces and Survey of NGC Delegates Statistical Analysis of gender and employment 1985-2021 (selected findings) Women s leadership statistics for COSATU provinces and Affiliates (current figures and comparisons between 2010 and 2021) Summary of selected findings of the Survey of COSATU NGC Delegates
COSATU Gender Review Objectives Review gender equality achievements and identify important gaps & challenges Collate COSATU gender resolutions from 1985 to date Review and evaluate implementation of COSATU s policies and perspectives on gender Identify significant changes in these perspectives and strategies over time Highlight challenges with implementation of policies and resolutions Ensure the active participation of COSATU and Affiliate activists in review process
COSATU Gender Review Methods Literature Review Statistical Analysis Documentary Review: COSATU Gender Resolutions Survey of COSATU Provinces and Affiliates Survey of COSATU NGC Delegates Focus Groups: Women Worker Leaders, Gender coordinators, Young Women Workers, Male gender champions NGC Workshop Commissions Interviews
Affiliate Response Rate to Survey Template Name of Affiliate AFADWU CEPPWAWU CWU DENOSA NEHAWU NUM PAWUSA POPCRU SACCAWU SACTWU SADTU SAEPU SAMATU SAMWU SASBO SATAWU Sub-totals Total Complete Data Incomplete Data No Data X X X 8 out of 16 Affiliates have completed some or all of the survey. We need data from the 8 remaining affiliates, and to complete data collection from 4 affiliates that have provided some or most (but not all) data. X X X X X X X X X X X All 9 provinces provided data. Some data is still needed from North West province. X X 4 (25%) 8 (50%) 4 (25%) 8 (50%) 9 (50%)
Key focus areas The gender review covered the following focus areas, however, this presentation focuses on statistics gathered during the gender review process: Women s representation in leadership, staff and participation in unions Gender structures and strategies GBV and Sexual harassment in the workplace and unions Gender and collective bargaining Organising vulnerable women workers and marginalised groups The role of men in gender struggles (and structures)
Brief Statistical Analysis of Gender and Brief Statistical Analysis of Gender and Employment 1985 Employment 1985- -2021 2021
1985 53 109 1995 62 120 130 2000 76 110 130 2005 74 118 142 2010 75 95 112 2015 2019 79 93 101 2021 employed Unemployed Expanded unemployed Discouraged Not economically active 78 98 109 77 93 106 141 159 181 152 183 150 130 148 125 142 110 139 127 137 144 shows the number of women per 100 men across different labour market indicators. For instance there were 53 women employed to every 100 men in 1985 and by Q2 2021 this has risen to 77 women for every 100 men. Women per 100 men in main labour market indicators The general lowering of the number of women to men in categories other than employment does suggest a general improvement in equity between sexes however more specific investigations of the nature of employment and unemployment underline that inequality remains ingrained in the labour market.
Youth unemployment (000) Unemployed (expanded) Unemployment rate Age Men women Men women 15-24 1,046,183 1,115,977 74.8% 84.0% 25-34 2,045,580 2,193,048 51.5% 62.0%
Gender distribution in occupations 1995-2021 1995 Gender distribution amongst occupations 2021 Gender distribution amongst occupations Domestic worker Elementary Elementary Plant and machine operator Plant and machine operator Craft and related trade Craft and related trade Skilled agriculture Skilled agriculture Sales and services Sales and services Clerk Clerk Technician Technician Professional Professional Manager Manager 0% 10% 20% 30% 40% 50% 60% 70% 80% 90% 100% 0% 10% 20% 30% 40% 50% 60% 70% 80% 90% 100% Men Women Men Women
Working hour categories and gender Working hours by sex 2001 Working hours by sex 2021 more than 45 hours per week more than 45 hours per week 40-45 hours per week 40-45 hours per week 30-39 hours per week 30-39 hours per week 15-29 hours per week 15-29 hours per week less than 15 hours per week less than 15 hours per week 0% 20% 40% 60% 80%100%120% 0% 20% 40% 60% 80% 100% 120% 2001 women 2001 men women men Women tend to dominate the lower categories of working hours and make up less of the 40-45 hour category. This has improved only marginally since 2001
Women's earnings as a % of men's earnings 1994- 2019 Womens median and mean monthly earnings as a % of mens earnings (100% = parity) 90.0% 80.0% 70.0% 60.0% 50.0% 40.0% 30.0% 20.0% 10.0% 0.0% 1994 2001 2007 2011 2017 2018 2019 Mean monthly earnings (Rands) Median monthly earnings (Rands)
Female and male union density (% of employed women and % of employed men that are union members) Women and Men Union density 2001-2021 Men 2021 Apr- Jun Women Jul-Sep Men 2019 Women Jul-Sep Men 2010 Women Sep-01 Men Women 0% 10% 20% 30% 40% 50% 60% 70% 80% 90% 100% Trade union members Not trade union members
Women as a proportion of workers and members 1998-2021 compared in COSATU organising areas 1998 Sector % women by industries unions) Construction 9% 11% Chemical, paper, printing and wood Communication 36% 34% Food and fishing 27% 22% Government (Admin, Health, etc) Educators 64% 64% Mining and energy 6% 4% Metal and auto 18% 16% Police and correctional services Agriculture 28% 31% Retail, Catering and Hotels Clothing and textile 72% 74% Local Authority 23% 21% Banking 61% 55% Transport 15% 10% 2021 % women by industries 16% 28% Change % women by industries % of women members (all % of women members (all unions) 10% 26% % of women members (all unions) 7% 2% -1% 10% 26% 16% 30% 41% 76% 38% 42% 74% -6% 14% 11% 4% 20% 16% 65% 58% 66% 21% 20% 34% 63% 21% 17% 34% 2% 15% 2% 10% -1% 17% 1% 16% 24% 18% 29% 51% 25% 55% 1% 2% -6% 8% 49% 47% 74% 44% 61% 16% 77% 41% 64% 20% 2% 21% 0% 1% 3% 20% 9% 10%
Women in employment and unions The slide above shows the proportionality of women in employment and membership in industries grouped by Union scope. The proportion of membership is for all unions not just COSATU There are relatively small changes in overall employment in most industries and where there are large changes such as in mining and construction these industries are nominally still small employers of women. Government administration and local authority employment however reflect large proportional and nominal changes. In most areas gender composition of membership matches or exceeds employment composition proportional changes with the exception of agriculture and construction.
Union density for women and men 2001-2021 Union density by sex all industries all employees The new Labour force Survey was instituted in 2000 and extended the focus sampling and questionnaire from the October Household surveys. Trade union density amongst employed women rose from 27,1% in 2001 to 28,2% by the Q3 2019 and then to 31,5% in Q2 2021. The last increase is due to the number of nonunion women losing work during the pandemic. For men there was a decline from 35,6% to 30,3% in the same period. This reflected an overall decline in union density over the period that can largely be attributed to rising proportions of more vulnerably employed workers during this time. Again an uptick in density to 34,4% is pandemic related to nonunionized workers relatively larger job losses than for unionized workers concentrated in permanent jobs. 2001 2019 2021 Women 27.1% 28.2% 31.5% Men 35.6% 30.3% 34.4% A closing of the gap does suggest some progress in terms of organising amongst women workers
Union membership density changes by main industry and sex 2001-2021 Male Members difference Female members difference Total difference in union membership Total difference employment union density change Union density amongst Women change Union density amongst men Change Agriculture, hunting, forestry and fishing Mining and quarrying Manufacturing Electricity, gas and water supply Construction Wholesale and retail trade Transport, storage and communication Financial intermediation, insurance, etc Community, social and personal services Private households Total 10,868 -2,050 8,818 -47,378 1.5% -1.1% 2.6% -157,848 -49,567 20,647 92,273 108,872 72,067 53,656 -4,954 13,608 9,225 136,185 37,320 -104,192 -54,521 34,255 101,499 245,057 109,387 -159,106 -174,622 19,835 419,322 671,830 309,802 5.5% 0.8% 21.5% 4.0% 5.6% 0.9% 13.8% 2.2% 1.4% -7.7% 8.7% 13.5% 6.2% 0.1% 30.0% 5.7% 3.1% -2.1% 214,485 119,340 333,825 1,069,127 4.3% 2.7% 5.5% 153,959 400,961 554,920 1,217,060 -5.5% -7.4% -0.6% -1,359 464,397 -193 -1,552 149,598 3,475,467 -0.3% 0.9% 0.0% 4.3% -1.1% -1.3% 763,099 1,227,497
Union membership density changes by main industry and sex In the 20 year period the number of workers employed across different formal industries increased by approximately 3,5 million employees or a 38% increase and union membership increased by 1,2 million members leading to a rise in union density of 0.9%. Density amongst women members increased by 4,3% while men declined by 1.3%. The most significant growth in union membership, nominally was amongst women during the 20 years from 2001 to 2021. Union membership grew by 42% over the period. Of the total growth in membership women made up 62%. This should be significant when assessing the change in representational presence of women in trade unions Most of the growth of women membership was in the community and social services industry, which is mostly government. Despite the number of women members increasing by over 400 000 in this sector, the density amongst female workers in fact declined by 7.4% which relates to the number of women increasing substantially as a proportion of workers in the industry. More than half of the women s membership growth is accounted for by the government sector.
Women became more consolidated in union membership up to the mid 1990s, and then after a small drop off in 2001 which could well be a statistical sampling variance in the move from the October household survey questionnaire to that of the labour force survey questionnaire there is an ongoing growth as a proportion of women within trade unions to 43.7% by Q3 2019 with a slight drop-off to Q2 2021 due to job losses amongst women. Women remain the minority of union members. Women as a proportion of all Union members women % of all union members 1995 2001 2010 2019 2021 1985 36.4 35.1% 39.6% 43.7% 43.1%
Women as a proportion of union membership 1995-2021 Women as a % of all union members 1995 - 2001 46% 44% 43% 44% 42% 40% 40% 38% 36% 35% 36% 34% 32% 30% 1995 2001 2010 2019 2021
Women union density and proportion of employment 2001-2021 Union density amongst employed women 2001-2021 Total Private households Women as a proportion of the employed 2001-2021 Community, social and personal services Total Financial intermediation, insurance, Private households Transport, storage and communication Community, social and personal services Wholesale and retail trade Financial intermediation, insurance, Construction Transport, storage and communication Electricity, gas and water supply Wholesale and retail trade Manufacturing Construction Mining and quarrying Electricity, gas and water supply Agriculture, hunting, forestry and fishing Manufacturing Mining and quarrying 0% 10% 20% 30% 40% 50% 60% 70% 80% 90% Agriculture, hunting, forestry and fishing 2021 2001 0% 10% 20% 30% 40% 50% 60% 70% 80% 90% 2021 2001
Work status sex and union membership 2001-2021 Work status, sex and union membership 2001-2021 (000's) Female non members 2021 Male Non members 2021 Female trade union members 2021 Male Trade union members 2021 Female non members 2001 Male Non members 2001 Female trade union members 2001 Male trade union members 2001 0 500 1,000 1,500 2,000 2,500 3,000 3,500 4,000 4,500 5,000 Permanent nature Limited duration Unspecified duration
2010 Q3 11,502 1,652 14.4% 2,660 23.1% 1,115 5,057 44.0% 902 117 % 2019 Q3 13,868 1,336 3,084 22.2% 1,117 7,448 53.7% 807 76 % 2021 Q2 12,460 Both sexes Individual and employer Union and employer Bargaining council Employer only No regular increment Other 9.6% 866 3,154 1,146 6,545 732 7.0% 25.3% 9.2% 52.5% 5.9% 0.1% 9.7% 8.1% Collective bargaining, gender and union membership 7.8% 1.0% 5.8% 0.5% 17 Women Individual and employer Union and employer Bargaining council Employer only No regular increment Other 5,006 698 13.9% 1,012 20.2% 521 10.4% 2,326 46.5% 401 48 6,313 570 1,276 20.2% 594 3,473 55.0% 375 27 5,642 384 1,278 618 2,977 379 9.0% 6.8% 22.7% 11.0% 52.8% 6.7% 0.1% 9.4% 8.0% 1.0% 5.9% 0.4% 5 Men Individual and employer Union and employer Bargaining council Employer only No regular increment Other 6,496 954 14.7% 1,648 25.4% 594 2,731 42.0% 501 68 7,555 766 10.1% 1,808 23.9% 524 3,975 52.6% 432 49 6,818 482 1,876 527 3,568 353 7.1% 27.5% 7.7% 52.3% 5.2% 0.2% 9.1% 6.9% 7.7% 1.0% 5.7% 0.6% 12
In the period since the item on the source of salary increments has been included in the quarterly Labour force survey in 2010 union negotiated settlements are more prominent amongst male workers with a marginal decreasing of the gap over the period. Women covered by bargaining council agreements were slightly fewer in number in 2010 but are now the majority of workers whose last wage increase was negotiated through a bargaining council at 618 thousand as opposed to men at 527 thousand in 2021. This reflects the relative strength of the public sector bargaining council system where women are in the majority as opposed to the growing vulnerability of private sector bargaining councils where men are in many cases in the majority. Collective bargaining, gender and union membership Plant and industry national bargaining forums primarily in the private sector sees between 20 and 23% of women gaining increments through union representation and a higher proportion of men between 25 and 28% in the period. A nominal gap of approximately 600 thousand between women and men gaining an increment through union employer bargaining remains across the decade despite a nominal uptick of approximately 270 thousand for women and 220 thousand for men. By 2021 33,7% of women workers secured increases through union bargaining (employer and councils) as opposed to 35.2% of men. This is not a lot more than figures for union density suggesting a relatively weak role for the extension of wage agreements to non parties through the bargaining council system but at the same time the relative potential of the use of such mechanisms to address a range of gender equity based outcomes in the Labour market including the hours of work and the gender pay gap.
Non-wage conditions of employment 2001-2021 2001 2010 2019 2021 Women Men Women Men Women Men Women Men Pension/retirement fund contribution 43.5% 53.5% 43.3% 47,5% 46.4% 49.9% 45,8% 51,3% Medical aid 21.3% 26.9% 27.7% 28.7% 29.8% 29.7% 31.1% 31.2% Any form of paid leave 56.1% 61.7% 62.2% 64.6% 65.4% 67.6% 68.2% 70.6% Maternity/paternity leave - - 57.1% 50.1% 60.0% 56.1% 76.8% 89.0% Written contract 49.0% 58.2% 76.4% 79.9% 80.5% 79.6% 83.4% 83.6%
COSATU Womens Leadership COSATU Women s Leadership Survey of COSATU Affiliates and Provinces
Womens Representation in COSATU Provincial and Local Women s Representation in COSATU Provincial and Local Leadership by Province, 2021 Leadership by Province, 2021 Province EC FS GP KZN LP MP NC NW WC POB 25% 25% 50% 25% 25% 25% 0% 25% 25% PEC 33% 37% 35% 38% 21% 35% 22% 48% LOB 34% 30% 39% 29% 29% 41% 19% 51%
% Women Members 2010 % Women in NEC 2010 % Women Members 2021 % Women in NEC 2021 % Women NOBs 2010 % Women NOBs 2021 Union CEPPWAWU CWU DENOSA NEHAWU NUM POPCRU SACCAWU SACTWU SADTU SAMWU SASBO SATAWU 22% 56% 91% 54% 9% 37% 55% 85% 65% 35% 68% 18% 20% 36% 54% 22% 9% 36% 16% 53% 15% 37% 41% 35% 17% 17% 71% 33% 27% 33% 33% 38% 50% 33% 20% 17% 89% 74% 37% 13% 12% 57% 33% 37% 60% 75% 68% 20% 37% 23% 33% 38% 50% 70% 27% 41% 36% 29% 33%
Women Organisers local to provincial level Organisers 2021 Union NEHAWU SACCAWU SACTWU SASBO SATAWU women men Organisers 1997 25% 23% 32% 64% 7% 75% 77% 68% 36% 93% level local branch regional women men 8% 20% 12% 92% 80% 88%
Women in Collective Bargaining Teams Affiliate NEHAWU SACCAWU SASBO Women Men 26% 31% 32% 74% 69% 68%
Selected Findings: Survey of COSATU Selected Findings: Survey of COSATU National Gender Committee National Gender Committee Delegates Delegates October 2021
How familiar are you with the COSATU Gender Policy? Extremely familiar 4% Not so familiar 22% Very familiar 37% Somewhat familiar 37%
How effectively has COSATU implemented its Gender Policy? Not so effectively 18% Very effectively 33% Somewhat effectively 49%
COSATUs Most Important Achievements duca on Awareness Cons tu of gender structures C Campaigns argaining Women s Representa on ender policy S olicy Campaigns
Most Important Priorities for NGC 0 0.5 1 1.5 2 2.5 3 3.5 4 4.5 GBV & SH Women's Representation Gender Wage Gap Parental Rights Organising Vulnerable Workers
How well has COSATU done in these areas? 0% 10% 20% 30% 40% 50% 60% 70% 80% 90% 100% GBV/SH workplace Representation of women Parental Rights SH in unions LGBTQI+ rights Gender pay gap Well/Very well Adequate Poorly/very poorly
How familiar are you with the COSATU SH Policy and Procedure? 50% 45% 40% 35% 30% 25% 20% 15% 10% 5% 0% Very familiar Somewhat familiar Not so familiar
Effectiveness in Combatting SH & GBV 0% 10% 20% 30% 40% 50% 60% 70% 80% 90% 100% Engaging on National Policy & legislation Awareness Raising on Sexual Harassment Workplace Agreements on SH & GBV Training of SH Offcers/Officials Holding perpetartors of GBV & SH accountable SH Case Handling Very effective Somewhat effective Not effective
Have you experienced violence/harassment in these spaces? public space 55% union 33% workplace 24% 0% 10% 20% 30% 40% 50% 60%
Barriers to Womens Participation in Leadership ac of educa on and training for women ac of gender awareness for men and women ac of support from the union Male dominated union culture ousehold and family responsibili es Se ual arassment artner at home not suppor ve
Challenges with gender policy implementation 0% 10% 20% 30% 40% 50% 60% 70% 80% There is too much focus on policy and not enough action/campaigns Union leadership structures are male-dominated Gender is not seen as important Gender is not mainstreamed in all union work Gender coordinators do not get training and support to drive implementation Gender structures do not have power
Measures to improve gender policy implementation 0% 10% 20% 30% 40% 50% 60% Budget allocation for gender work Education & training programmes for women More women in leadership Workplace-based gender campaigns Full-time gender coordinators in unions Constitutional gender structures Gender awareness raising for men
Building Womens participation and representation in unions Key overall strategies to enhance women s participation and representation include the following: Organising women wor ers to increase women s trade union membership Increasing women s participation at all levels of the union from organising women workers, to election of women shop stewards to electing women local, provincial and national levels Creating specific structures for women, to promote gender activism and ensure the mainstreaming of gender COSATU has implemented all of these strategies with significant advances, however gender inequalities remain pervasive in employment, pay and leadership, as well as unrelenting sexual harassment and gender-based violence. The advancement of the demand for increased representation of women in leadership without corresponding organisational change often leads to the inclusion of women in unchanged structures.
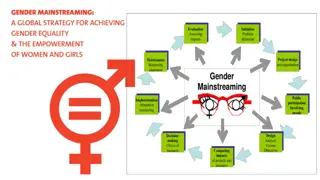
Conclusion To sum up, while there are many advances and areas of progress in all areas of COSATU s gender policies and resolutions, gender discrimination, se ism, se ual harassment and under-representation of women in unions remain persistent. The contradictions between policy and practice are clearly summed up by Benjamin (2015): This disconnect between labour union policy and practice has parallels in many countries around the world, even as unions have become a primary global vehicle for advancing gender equality in both the North and the global South. Representing more than 70 million women worldwide, unions have expanded their women s rights and gender equality agendas in the wor place, and in society, and won improved wages and working conditions for millions of workers. At the same time, even in countries where unions have strong gender policies, pro-equality politics, and high percentages of female members, institutional and leadership limitations and the heavy weight of society-wide discrimination against women and wor ers can mean that women wor ers rights and voices remain marginalized. The ILO participatory gender audit (2012) identifies three important areas of analysis the three S s including Substance, Structure and Staffing. These three areas were identified as important action fronts for mainstreaming gender. The goals for the organisation to aim towards ultimately would be: to ensure gender analysis and mainstreaming in the substance of the organisation s work to ensure that in terms of structure there are systems and mechanisms for planning, implementation, monitoring and accountability on gender mainstreaming to ensure that there is gender equity and equality in staffing
Next steps There is a need for implementation of comprehensive strategies as identified in COSATU resolutions and policies, to advance women s participation, representation and leadership in unions, including: Quotas & targets, additional seats (portfolios, company-based gender coordinators and gender women s committee representation) Education, mentorship and empowerment Identifying barriers and removing obstacles to women s participation (childcare, timing of meetings, se ual harassment, challenging stereotypes and sexism) There was widespread agreement that COSATU has developed a range of progressive gender policies, however the Federation has had uneven success in policy implementation. A number of measures identified to improve policy implementation include: Budget allocation for gender work Education and training programmes for women More women being elected into leadership Workplace-based gender campaigns Full-time gender coordinators in unions Constitutional gender structures Gender awareness raising for men and women A significant minority of unions, including NEHAWU, SACCAWU, SADTU, SACTWU, SATAWU and SASBO conduct regular gender audits, monitoring and evaluation (or have the capacity to access data on request) It is essential to institute regular reporting of gender policy implementation by COSATU Affiliates and Provinces to the COSATU CEC, this will help to ensure proper monitoring, evaluation and planning The COSATU Gender Review will be presented to Provincial Gender Conferences for further engagement and for development of recommendations for discussion at the COSATU Gender Conference and COSATU Congress
