Comparison of Ranibizumab vs. PRP in Diabetic Retinopathy Clinical Trial
Clinical research comparing intravitreous ranibizumab with PRP for proliferative diabetic retinopathy, highlighting changes in peripapillary RNFL thickness, visual acuity outcomes, and implications for DME development. The study focuses on the correlation between RNFL changes and visual field sensitivities, as well as imaging techniques for accurate RNFL measurements. Baseline characteristics of the study participants are also detailed.
Download Presentation

Please find below an Image/Link to download the presentation.
The content on the website is provided AS IS for your information and personal use only. It may not be sold, licensed, or shared on other websites without obtaining consent from the author. Download presentation by click this link. If you encounter any issues during the download, it is possible that the publisher has removed the file from their server.
E N D
Presentation Transcript
Diabetic Retinopathy Clinical Research Network PRP vs intravitreous ranibizumab for PDR: Comparison of the peripapillary RNFL in a Randomized Clinical Trial Glenn J. Jaffe, M.D. Supported through a cooperative agreement from the National Eye Institute; National Institute of Diabetes and Digestive and Kidney Diseases; National Institutes of Health, Department of Health and Human Services EY14231, EY14229, EY018817 1
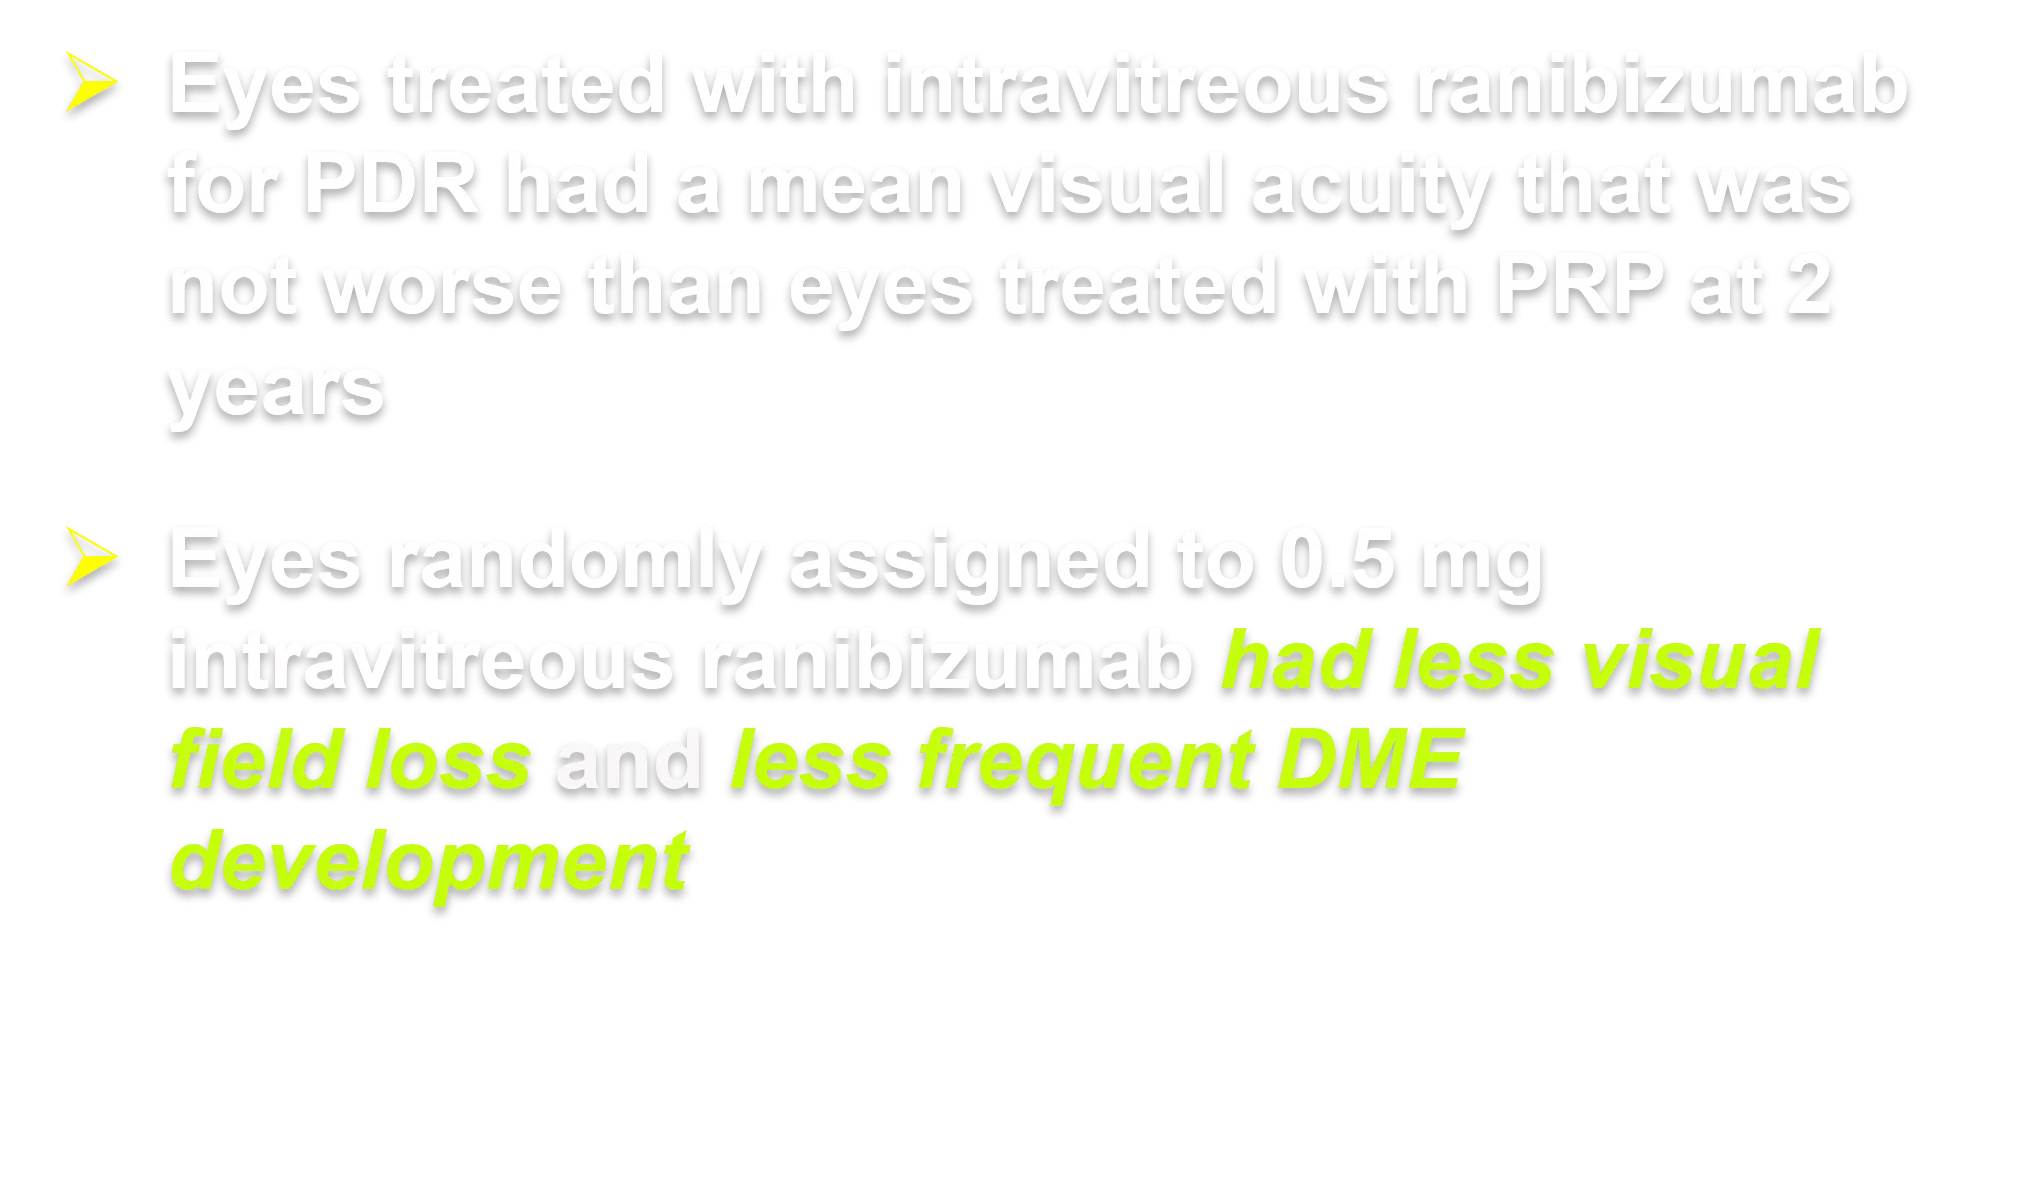
Protocol S primary results Eyes treated with intravitreous ranibizumab for PDR had a mean visual acuity that was not worse than eyes treated with PRP at 2 years Eyes randomly assigned to 0.5 mg intravitreous ranibizumab had less visual field loss and less frequent DME development JAMA. 2015;314(20)2137-2146 2
Literature RNFL thinning associated with VF loss Thinning of RNFL with PRP and anti-VEGF DME: thicker RNFL, inner retinal edema 3
Literature contd Diabetic RNFL +/- DR thinner than normal Normal RNFL thickness could be edematous ME resolution: thinner than normal RNFL 4
Objectives Pre-planned To compare changes in the peripapillary RNFL at 2 years between the ranibizumab and PRP groups 5
Objectives Pre-planned To compare changes in the peripapillary RNFL at 2 years between the ranibizumab and PRP groups Post-Hoc To correlate changes in RNFL with changes in VF sensitivities at 2 yrs 60-4 HFV Mean deviation 30-2 HVF Mean deviation To correlate changes in RNFL with changes in CST at 2 yrs 6
Imaging of the RNFL Spectralis or Zeiss Cirrus OCT RNFL Images readjusted by DRC if automated measurement inaccurate b/c: 1. Decentration 2. Artifacts 3. Segmentation algorithm failure 7
Baseline characteristics Ranibizumab Group (N = 77) 52 43% PRP Group (N = 69) 50 43% Participants Included Age (yrs) Median Women Race White Visual Acuity (letter score) Median Central Subfield Thickness ( m)- Median 64% 58% 80 (20/25) 81 (20/25) 219 227 8
Pre-Planned Objective TREATMENT GROUP COMPARISON OF CHANGES IN THE RNFL at 2 yrs 9
Average RNFL Measurements of the 2-Year Cohort Ranibizumab Group (N = 68) N=35 96 19 85 15 N=33 94 21 83 16 PRP Group (N = 57) N=32 97 20 95 19 N=25 97 23 89 12 Average RNFL ( m) Heidelberg Spectralis Baseline At 2 years Zeiss Cirrus Baseline At 2 years 10
Average RNFL: At Baseline Ranibizumab N = 68 Prompt PRP N = 57 Lower than normal Cirrus: < 76.9 m Heidelberg OCT: < 80.4 m Normal Cirrus: 76.9-120.5 m Heidelberg OCT: 80.4-131.6 m Above normal Cirrus: > 120.5 m Heidelberg OCT: >131.6 m 100% 71% 80% 74% Percentage of Eyes 60% 40% 22% 18% 20% 9% 7% 0% Lower than Normal Normal Greater than normal 11
Average RNFL: At 2 Years Ranibizumab N = 68 Prompt PRP N = 57 Lower than normal Cirrus: < 76.9 m Heidelberg OCT: < 80.4 m Normal Cirrus: 76.9-120.5 m Heidelberg OCT: 80.4-131.6 m Above normal Cirrus: > 120.5 m Heidelberg OCT: >131.6 m 100% 79% 80% Percentage of Eyes 65% 60% 35% 40% 19% 20% 2% 0% 0% Lower than Normal Normal Greater than normal 12
Eyes with Normal Average RNFL at Baseline 100% 90% 81% Percentage of Eyes 80% 60% 40% 19% 20% 7% 2% 0% 0% Lower than Normal at 2 years Normal at 2 years Greater than normal at 2 years Prompt PRP N = 42 Ranibizumab N = 48 13
Mean change in Average RNFL V 5 5 Mean change in Average RNFL - -1.9 1.9 - -4.3 4.3 -5 -5 - -9.6 9.6 - -10.9 10.9 -15 -15 Adjusted Mean Difference at 2 years : -4.9 m (P-value<0.001) 95% CI: (-7.2 m, -2.6 m) -25 -25 Baseline Baseline Year-1 Year-1 Visit Visit Year-2 Year-2 Ranibizumab Ranibizumab N = 74 Prompt PRP Prompt PRP N = 66 14 At 2 years
Mean change in Average RNFL: No Baseline DME V 5 5 + 0.7 Mean change in Average RNFL - -2.5 2.5 -5 -5 - -7.5 7.5 - -8.6 8.6 -15 -15 Adjusted Mean Difference at 2 years : -5.0 m (P-value<0.001) 95% CI: (-7.8 m, -2.3 m) -25 -25 Baseline Baseline Year-1 Year-1 Visit Visit Year-2 Year-2 Ranibizumab Ranibizumab N=56 Prompt PRP Prompt PRP N=48 15 At 2 years
Mean change in Average RNFL: With Baseline DME V 5 5 Mean change in Average RNFL -8.0 -5 -5 - -9.3 9.3 - -16.8 16.8 - -17.9 17.9 -15 -15 Adjusted Mean Difference at 2 years : -2.3 m (P-value=0.32) 95% CI: (-6.7 m, +2.2 m) -25 -25 Baseline Baseline Year-1 Year-1 Visit Visit Year-2 Year-2 Ranibizumab Ranibizumab N=18 Prompt PRP Prompt PRP N=18 16 At 2 years
Post-Hoc Objectives 1. Correlate changes in the RNFL with changes in visual field sensitivities at 2 years 2. Correlate changes in the RNFL with changes in the central subfield thickness (CST) at 2 years 17
2-Year correlation of RNFL changes with Change in Mean Deviation (60-4 Test) PRP Group N = 40 Ranibizumab Group N = 45 50 50 r= +0.33 P-value=0.035 r=-0.27 P-value=0.07 Change in Average RNFL 25 25 0 0 -25 -25 -50 -50 -10 -5 0 5 10 -10 -5 0 5 10 Change in Mean Deviation (60-4 test) Change in Mean Deviation (60-4 test) 18
2-Year correlation of RNFL changes with CSF changes Ranibizumab Group N = 74 PRP Group N = 66 50 50 r= +0.34 Pvalue=0.005 r= +0.63 Pvalue <0.001 Change in Average RNFL 25 25 0 0 -25 -25 -50 -50 -400 -200 0 200 400 -400 -200 0 200 400 Change in CSF Thickness (Microns) Change in CSF Thickness (Microns) 19
2-Year correlation of RNFL changes with CSF changes: No Baseline DME Ranibizumab Group N = 56 PRP Group N = 48 50 50 r= +0.59 P-value <0.001 r= +0.05 P-value=0.75 Change in average RNFL 25 25 0 0 -25 -25 -50 -50 -100 -50 0 50 100 -100 -50 0 50 100 Change in CSF Thickness (Microns) Change in CSF Thickness (Microns) 20
Example Baseline 2 Years
Conclusions RNFL thinning with RBZ and PRP at 2 years Significantly greater RNFL reduction with RBZ Most RNFL differences in yr. 1 RNFL thinning in yr. 2 similar RNFL thinning mechanism in 2 groups may differ
Discussion VF sensitivity and RNFL changes: minimal in both groups; however sample size was relatively small In RBZgroup RNFL thinning may be from decreased retinal edema 23
Clinical Implication OCT-derived RNFL thickness measurements are used to provide objective means to assess glaucoma progression in non-PDR eyes Due to fluid changes in the inner retina during ranibizumab therapy, RNFL measurements would be a poor means to diagnose and monitor the progression of glaucoma in these eyes. 24
Thank You on Behalf of the Diabetic Retinopathy Clinical Research Network (DRCR.net) 25
