Comparison of NNRTI vs. NNRTI and RPV/FTC/TDF vs. EFV/FTC/TDF in STAR Study
STAR Study compared the efficacy and safety of RPV/FTC/TDF and EFV/FTC/TDF in treatment-naive HIV patients. The study included 394 participants in each group, assessing HIV RNA suppression rates, CD4 count improvements, treatment responses, and resistance analyses up to 48 weeks. Results showed RPV/FTC/TDF was non-inferior to EFV/FTC/TDF in achieving HIV RNA levels below 50 c/mL. RPV/FTC/TDF group demonstrated more favorable response rates and minimal resistance mutations. Overall, RPV/FTC/TDF showed promising outcomes and tolerability in comparison to EFV/FTC/TDF.
Uploaded on Sep 16, 2024 | 3 Views
Download Presentation

Please find below an Image/Link to download the presentation.
The content on the website is provided AS IS for your information and personal use only. It may not be sold, licensed, or shared on other websites without obtaining consent from the author.If you encounter any issues during the download, it is possible that the publisher has removed the file from their server.
You are allowed to download the files provided on this website for personal or commercial use, subject to the condition that they are used lawfully. All files are the property of their respective owners.
The content on the website is provided AS IS for your information and personal use only. It may not be sold, licensed, or shared on other websites without obtaining consent from the author.
E N D
Presentation Transcript
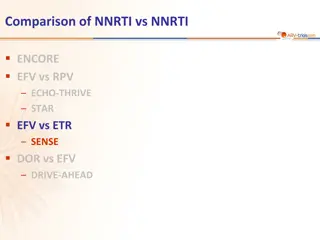
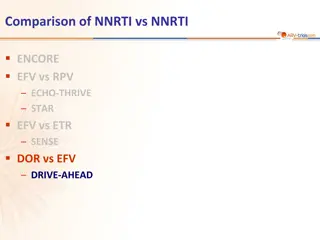
Comparison of NNRTI vs NNRTI ENCORE EFV vs RPV ECHO-THRIVE STAR EFV vs ETR SENSE DOR vs EFV DRIVE-AHEAD
STAR Study: RPV/FTC/TDF vs EFV/FTC/TDF Design Randomisation* 1 : 1 Open-label W48 W96 > 18 years ARV-na ve N = 394 RPV/FTC/TDF QD STR HIV RNA > 2,500 c/mL Any CD4 cell count eGFR > 50 mL/min Sensitivity to EFV, FTC and TDF on genotype No RPV resistance mutations** N = 392 EFV/FTC/TDF QD STR Concomitant use of proton pump inhibitors was not allowed * Randomisation was stratified by HIV RNA (< or > 100,000 c/mL) ** K101E/P, E138A/G/K/Q/R, Y181C/I/V, H221Y Objective Non inferiority of RPV/FTC/TDF at W48: % HIV RNA < 50 c/mL by intention to treat, snapshot analysis (1-sided significance level of 2.5%, lower margin of the 97.5% CI for the difference = -12%, 95% power) Cohen C. AIDS 2014;28:989-97 STAR
STAR Study: RPV/FTC/TDF vs EFV/FTC/TDF Baseline characteristics and patient disposition RPV/FTC/TDF N = 394 37 7% 4.8 34% 396 54 (13.7%) 12 10 15 6 5 1 2 3 0 EFV/FTC/TDF N = 392 35 7% 4.8 36% 385 72 (18.4%) 3 34 10 4 13 1 0 3 1 Median age, years Female HIV RNA (log10c/mL), median HIV RNA > 100,000 c/mL CD4 cell count (/mm3), mean Discontinuation by W48 (N) For lack of efficacy For adverse event Lost to follow-up Non compliance Withdrew consent Protocol violation Pregnancy Investigator s decision Death Cohen C. AIDS 2014;28:989-97 STAR
STAR Study: RPV/FTC/TDF vs EFV/FTC/TDF Response to treatment (HIV RNA < 50 c/mL) at week 48 RPV/FTC/TDF EFV/FTC/TDF % Primary analysis 100 88.8 85.3 85.8 79.9 81.6 81.6 79.6 81.7 75 50 25 0 ITT, TLOVR ITT, snapshot ITT snapshot, by baseline HIV-1 RNA > 100,000 c/mL Adjusted difference (95% CI) = 4.1% (-1.1 ; 9.2) < 100,000 c/mL Difference (95% CI) = 7.2% (1.1 ; 13.4) Adjusted difference (95% CI) = 5.9% (0.6 ; 11.2) Difference (95% CI) = -1.8% (-11.1 ; 7.5) Median CD4/mm3increase at W48: + 200 RPV/FTC/TDF vs + 191 EFV/FTC/TDF Cohen C. AIDS 2014;28:989-97 STAR
STAR Study: RPV/FTC/TDF vs EFV/FTC/TDF Resistance analysis through week 48 RPV/FTC/TDF 20 (5%) 17 (4.3%) 1.9% 9.0% 16 8 6 5 - - - 16 15 3 EFV/FTC/TDF 7 (2%) 3 (0.8%) 0.8% 0.7% 3 - - - 1 1 1 1 1 0 Resistance analysis population* Resistance to antiretrovirals In patients with baseline HIV RNA < 100,000 c/mL In patients with baseline HIV RNA > 100,000 c/mL Any primary NNRTI resistance Y181C/I E138K/Q K101E K103N Y188L G190E/Q Any primary NRTI resistance M184V/I K65R/N * HIV RNA > 400 c/mL and suboptimal virologic response (confirmed < 1 log10c/mL decrease in HIV RNA at W8) virologic rebound (2 consecutive visits with HIV RNA > 50 c/mL after achieving < 50 c/mL, 2 consecutive visits with > 1 log10c/mL increase in HIV RNA from the nadir) or HIV RNA > 400 c/mL at W48 or last visit Cohen C. AIDS 2014;28:989-97 STAR
STAR Study: RPV/FTC/TDF vs EFV/FTC/TDF Safety through week 48 RPV/FTC/TDF 7.4% 1.8% EFV/FTC/TDF 13.8% 4.8% Grade 3-4 treatment-emergent adverse events Related to study drug Treatment-emergent adverse events of specific interest in > 5% in either arm RPV/FTC/TDF 29.7% 6.6% 9.6% 2.5% 12.4% 15.7% 5.8% 6.6% 5.1% 17.3% 5.3% 6.1% EFV/FTC/TDF 50.5% 22.2% 14.0% 13.5% 13.5% 37.5% 24.5% 8.9% 8.4% 21.2% 1.0% 12.0% Nervous system events Dizziness Insomnia Somnolence Headache Psychiatric events Abnormal dreams Depression Anxiety Rash events Folliculitis Rash Cohen C. AIDS 2014;28:989-97 STAR
STAR Study: RPV/FTC/TDF vs EFV/FTC/TDF Mean changes in fasting lipids (mg/dL) at week 48 RPV/FTC/TDF EFV/FTC/TDF TC LDL TG HDL 25 22 p < 0.001 for all between treatment groups using ANOVA 20 14 15 8 8 10 5 2 1 1 0 -5 -8 121 -10 Mean baseline values (mg/dL) 164 163 104 103 129 44 44 Change in total cholesterol/HDL-cholesterol at week 48 was -0.2 in both arms Cohen C. AIDS 2014;28:989-97 STAR
STAR Study: RPV/FTC/TDF vs EFV/FTC/TDF Conclusion at week 48 In treatment-naive HIV-infected patients, RPV/FTC/TDF demonstrated non inferior efficacy and improved tolerability compared with EFV/FTC/TDF, at week 48 RPV/FTC/TDF was statistically significant superiority in efficacy for patients with baseline HIV-1 RNA 100,000 c/mL Virologic efficacy was similar for patients with baseline HIV-1 RNA > 100,000 c/mL More discontinuations due to adverse events in the EFV/FTC/TDF arm Significantly lower rates of nervous system and psychiatric adverse events in the RPV/FTC/TDF arm than in the EFV/FTC/TDF arm Differences primarily due to dizziness and abnormal dreams Virologic failures rates were similar between the 2 treatment arms A greater proportion of patients in the RPV/FTC/TDF arm developed primary emergent NRTI or NNRTI resistance mutations at virologic failure Cohen C. AIDS 2014;28:989-97 STAR
STAR Study: RPV/FTC/TDF vs EFV/FTC/TDF Virologic outcomes at W96, snapshot analysis RPV/FTC/TDF N = 394 EFV/FTC/TDF N = 392 Virologic success (HIV-1 RNA < 50 c/mL) 77.9% 72.4% Difference (95% CI) 5.5 (- 0.6 to 11.5) ; p = 0.076 Virologic failure 9.4% 5.9% HIV-1 RNA 50 c/mL 1.5% 1.5% Treatment discontinuation due to lack of efficacy 4.1% 1.0% Treatment discontinuations due to other reasons and last HIV-1 RNA 50 c/mL 3.8% 3.3% No data in the study window 12.7% 21.7% Treatment discontinuation due to adverse event or death 3.0% 10.7% Treatment discontinuations due to other reasons and last HIV-1 RNA < 50 c/mL 7.9% 9.4% Missing data while receiving study drug 1.8% 1.5% Van Lunzen J. AIDS 2016;30:251-9 STAR
STAR Study: RPV/FTC/TDF vs EFV/FTC/TDF Response to treatment (HIV RNA < 50 c/mL) at week 96 RPV/FTC/TDF at W48 EFV/FTC/TDF at W48 % RPV/FTC/TDF at W96 EFV/FTC/TDF at W96 100 Favors Favors RPV/FTC/TDF 89 EFV/FTC/TDF 82 82 80 79 80 76 75 71 HIV RNA at baseline 60 < 100,000 c/mL 1.1 7.2 13.4 W48 7.6 15.1 40 0.2 W96 p = 0.046 > 100,000 c/mL 20 -11.1 -1.8 7.5 W48 1.5 11.6 -8.7 W96 p = 0.78 0 231/ 260 204/ 250 205/ 260 178/ 250 107/ 134 116/ 142 102/ 134 106/ 142 -12% 0 12% < 100,000 c/mL > 100,000 c/mL Baseline HIV RNA Van Lunzen J. AIDS 2016;30:251-9 STAR
STAR Study: RPV/FTC/TDF vs EFV/FTC/TDF Response to treatment (HIV RNA < 50 c/mL) at week 96 % RPV/FTC/TDF EFV/FTC/TDF 100 Favors Favors RPV/FTC/TDF EFV/FTC/TDF 80.6 80 73 CD4 at baseline 68.6 60.4 -8.0 10.7 - 26.7 60 p = 0.40 < 200/mm3 40 7.7 14.0 1.3 > 200/mm3 p = 0.018 20 -20% 0 20% 0 53 51 341 341 < 200/mm3 > 200/mm3 Baseline CD4+ cell count Van Lunzen J. AIDS 2016;30:251-9 STAR
STAR Study: RPV/FTC/TDF vs EFV/FTC/TDF Resistance analysis at week 96 RPV/FTC/TDF (N = 394) EFV/FTC/TDF (N = 392) Baseline-W48 W48-W96 Baseline-W48 W48-W96 Subjects in the Resistance Analysis Population 20 (5%) +4 (1%) 7 (1.8%) +2 (0.5%) Subjects with Resistance Data 20 (5%) +4 (1%) 7 (1.8%) +2 (0.5%) Subjects with Resistance to ARVs 17 (4%) +4 (1%) 3 (0.8%) +1 (0.3%) 16 (4%) +4 (1%) +4 +0 +0 +2 3 (1%) +1 (0.3%) +0 +0 +0 +1 E138K/Q (N = 6) Y181C/I (N = 8) K101E (N = 5) V90I (N = 6) K103N (N = 1) Y188L (N = 1) G190E/Q (N = 1) M230L (N = 0) Any primary NNRTI-R Key NNRTI-R 16 (4%) +4 (1%) +4 +0 Any primary NRTI-R Key NRTI-R 1 (0.3%) M1841 (N = 1) +1 (0.3%) +1 M184V/I (N = 15) K65R/N (N = 3) With baseline HIV RNA < 100,000 c/mL > 100,000 c/mL 5/260 (2%) 12/134 (9%) +4 (1%) +0 2/250 (1%) 1/142 (0.7%) +1 (0.4%) +0 Porter DP. HIV Clin Trials 2015;16:30-8 ; Van Lunzen J. AIDS 2016;30:251-9 STAR
STAR Study: RPV/FTC/TDF vs EFV/FTC/TDF Most frequently reported treatment-emergent adverse events leading to permanent study drug discontinuation RPV/FTC/TDF (N = 394) EFV/FTC/TDF (N = 392) W1- W4 W5- W48 W48- W96 W1- W4 W5- W48 W48- W96 Total Total 24 Psychiatric disorder 0 1 0 1 (0.3%) 5 11 8 (6.1%) Nervous system disorder 0 2 1 3 (0.8%) 5 2 1 8 (2.0%) Skin and subcutaneous tissue disorder (e.g. rash) 0 0 0 0 7 0 0 7 (1.8%) Clinical laboratory investigation 0 2 2 4 (1.0%) 0 2 0 2 (0.5%) General disorder (e.g. fatigue) 0 0 0 0 3 1 1 5 (1.3%) Gastrointestinal disorder 0 1 0 1 (0.3%) 1 2 0 3 (0.8%) Grade 3 4 treatment-emergent adverse event deemed related to study drug : 2.3% RPV vs 5.6% EFV Median changes from baseline to W96 in creatinine clearance : - 5.2 mL/min in the RPV group and + 4.3 mL/min in the EFV group 3 discontinuations for renal events : 1 in the RPV group and 2 in the EFV group Van Lunzen J. AIDS 2016;30:251-9 STAR
STAR Study: RPV/FTC/TDF vs EFV/FTC/TDF HIV Symptom Index Questionnaire at W96 RPV/FTC/TDF: significant reduction in occurrence of 18/20 symptoms vs baseline (p < 0.039) EFV/FTC/TDF: significant reduction in occurrence of 7/20 symptoms vs baseline (p < 0.033) Significant between-group differences in symptom occurrence vs baseline for 8 symptoms, all favoring RPV/FTC/TDF Overall satisfaction (HIV Treatment Satisfaction Questionnaire) at W96 High in both groups Quality of life (SF-12V2) The between-group difference in the median change from baseline at W96 for the physical health composite score was not significant The difference for the mental health composite score was significant, favoring RPV/FTC/TDF (p = 0.014) Van Lunzen J. AIDS 2016;30:251-9 STAR
STAR Study: RPV/FTC/TDF vs EFV/FTC/TDF Conclusion at W96 In treatment-naive, HIV-1-infected adults, 96-week RPV/FTC/TDF treatment demonstrated noninferior efficacy and better tolerability than EFV/FTC/TDF Significant differences in virologic success between subgroups with HIV-1 RNA 100,000 c/mL and > 200 CD4/mmm3could be related to the higher rate of discontinuations due to adverse events in the EFV/FTC/TDF group The higher virologic failure rates observed for RPV/FTC/TDF with baseline HIV-1 RNA > 500 000 c/mL and CD4+ cell count 200/mm3were mainly due to a higher rate of discontinuation due to lack of efficacy in this group (limitation: low number of patients in those categories) Rates of resistance development through W96 were low (5.3% RPV/FTC/TDF ; 1.0% EFV/FTC/TDF) with infrequent emergent resistance after W48 Development of resistance at failure: 88% RPV/FTC/TDF vs 44% EFV/FTC/TDF ; resistance in RPV/FTC/TDF group was more frequent if baseline HIV-1 RNA > 100,000 c/mL Better safety and tolerability profile of RPV/FTC/TDF vs. EFV/FTC/TDF over 96 weeks of treatment (limitation: open-label trial) Van Lunzen J. AIDS 2016;30:251-9 STAR
