Colonel George J. Iles Elementary School Overview
This document provides an overview of Colonel George J. Iles Elementary School's strengths, student growth, situation, and improvement initiatives in June 2019. The school showcases a commitment to family engagement, student leadership, and community partnerships, along with student growth achievements and staff challenges faced during the 2018-2019 academic year.
Uploaded on Mar 02, 2025 | 0 Views
Download Presentation

Please find below an Image/Link to download the presentation.
The content on the website is provided AS IS for your information and personal use only. It may not be sold, licensed, or shared on other websites without obtaining consent from the author.If you encounter any issues during the download, it is possible that the publisher has removed the file from their server.
You are allowed to download the files provided on this website for personal or commercial use, subject to the condition that they are used lawfully. All files are the property of their respective owners.
The content on the website is provided AS IS for your information and personal use only. It may not be sold, licensed, or shared on other websites without obtaining consent from the author.
E N D
Presentation Transcript
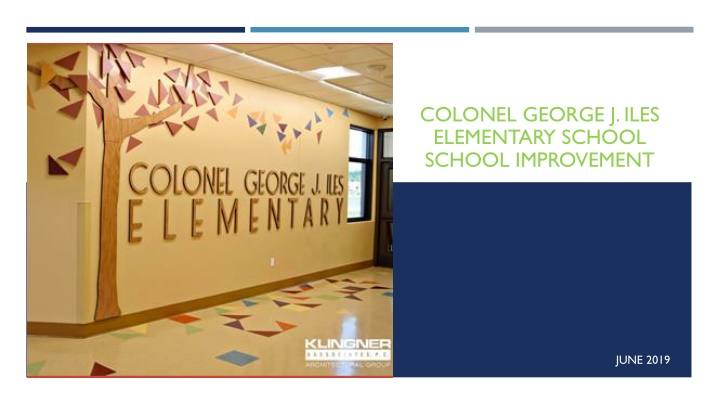
COLONEL GEORGE J. ILES ELEMENTARY SCHOOL SCHOOL IMPROVEMENT JUNE 2019
MISSION Roots to grow! Wings to fly!
STRENGTHS Family Engagement Served over 1000 at soup supper Averaged 400 participants at Family Nights - Read Night, STEM, Family Fit Night 600 served at Breakfast with Buddies Student Leadership Student-led Red Tail Rally Morning Meetings Kindergarten and 5th grade students served as leaders during Kindergarten Round-up Student-produced monthly Red Tail Report Recess Improvement Team
STRENGTHS CONTINUED Relational Capacity Cross-Wing Buddy Classrooms Community Partnerships - Family Fit Night,Madison Park Christian Church Strong UniversalTeam Pod Communities: Morning Meetings, Goal Setting Arrival music on Fridays (Mr. Oliver's Dance Party) Red Tail Rallies Trading Post comprised mainly of opportunities that built relational capacity between staff and students Community Service Projects
STRENGTHS CONTINUED Development of Leadership Team Reviewed AVID coaching domains to develop school culture Discussed relational capacity for students and staff Student Success Center Created and implemented the beginning of March Focus on the zones of regulation Created in response to student needs and staff feedback 5 Essentials Socialization Collaborative Practices
SITUATION: BUILDING OVERALL 2018-2019 636 different students served Free/Reduced Lunch: ~67% (388 students or 15 of the 27 classrooms) Ethnicity: 26% (151 students) Chronic Truancy: 13.5% (86 students) Special Education: 16% (95 students) Certified Staff/Student Ratio: 12.7 Average Class Size: 24 Staffing Situation: SAMs were not able to work in roles for which they applied and were originally hired, 2 teachers on remediation plans, 2 mid-year teacher resignations, 1 teacher on a professional support plan, full-time interventionist position was filled with a 120-day retiree, 3 staff members took FMLA leave, 18 of the full-time staff members (42%) were non-tenured.
STUDENT GROWTH Student Goals: 789 goals met/912 total goals = 86% Average Teacher SLO met Objectives: 45/46 SLO goals met = 97% Number of Student Referrals for the 18-19 School Year: 1550 Overall Attendance for the 18-19 School Year: 92%
AREAS TO IMPROVE Increase student achievement in ELA and Math for college and career readiness Continue to broaden Social Emotional Support System Deepen relationships: Students, Colleagues, and Families
SITUATION: ACADEMIC IAR - ELA 2018-2019 ELA Student Count Level 1 Level 2 Level 3 Level 4 Level 5 Did not Meet Partially Approached Met Exceeded Met 03 04 05 Total 95 102 103 300 28 21 20 69 29.5% 20.6% 19.4% 23.0% 15 22 21 58 15.8% 21.6% 20.4% 19.3% 26 20 36 82 27.4% 19.6% 35.0% 27.3% 21 30 25 76 22.1% 29.4% 24.3% 25.3% 5 9 1 15 5.3% 8.8% 1.0% 5.0%
SITUATION: ACADEMIC MAP - ELA 2018-2019 Points away from Norm (Fall) Assessments Periods Below (Fall, Winter, Spring) Points away from Norm (Spring) Was the Gap Closed? Reading Kdg 1st 2nd 3rd 4th 5th 2.4 Below 0.9 Below 10.3 Below 3.2 Below 4.8 Below 6.7 Below 2/3 3/3 3/3 3/3 3/3 3/3 1.2 Above 2.4 Below 6.5 Below 3.0 Below 1.6 Below 3.7 Below Yes No Yes Yes Yes Yes Reading MAP - 5 of 6 grades were below the norm Fall, Winter, Spring Kdg grew from below the Norm Mean RIT to above the norm from Fall to Spring 5 of 6 grades grew closer to Norm Mean RIT from Fall to Spring 3 of 6 grades finished above District Norm Mean RIT
SITUATION: ACADEMIC IAR - MATH 2018-2019 Math Student Level 1 Level 2 Level 3 Level 4 Level 5 Grade Count Did not Meet Partially Approached Met Exceeded Met 28 27 36 91 03 04 05 Total 94 102 103 299 14 16 19 49 14.8% 15.2% 18.4% 16.3% 29.7% 26.4% 34.9% 30.4% 23 33 19 75 24.4% 32.3% 18.4% 25% 23 24 27 74 24.4% 23.5% 26.2% 24.7% 6 2 2 10 6% 1% 1% 3%
SITUATION: ACADEMIC MAP - MATH 2018-2019 Points away from Norm (Fall) 2.2 Below 2.2 Below 8.3 Below 4.8 Below 5.3 Below 4.9 Below Assessments Periods Below (Fall, Winter, Spring) 1/3 1/3 3/3 3/3 3/3 3/3 Points away from Norm (Spring) 3.5 Above 2.2 Above 4.3 Below 1.3 Below 2.4 Below 4.2 Below Was the Gap Closed? Yes Yes Yes Yes Yes Yes Math Kdg 1st 2nd 3rd 4th 5th Math MAP - 4 of 6 grades were below the norm Fall, Winter, and Spring 2 of 6 grades (Kdg and 1st) grew from below the Norm Mean RIT to above the norm from Fall to Spring 4 of 6 grades grew closer to the Norm Mean RIT 2 of 6 grades finished above District Norm Mean RIT
GOAL Academics: Increase the percent of students meeting/exceeding on ELA and Math IAR by 2% Focus area: Deepen understanding through writing in all subject areas. Professional development to assist teachers in providing opportunities for: Writing About Reading: Student support and analysis On Demand Writing Math: Writing to explain Writing to Learn in Social Studies and Science: Evidence and student thinking
SITUATION: SEL UNIVERSAL SYSTEM IS IN PLACE, EFFECTIVE FOR 521 STUDENTS OR 82% OF THE STUDENT POPULATION (2 OR FEWER ODRS). 44 students earned out-of-school suspension (thus, removing them from instruction) - 109 total incidents for the year: WHILE SEVERAL INFORMAL TIER 2 SUPPORTS WERE INITIATED THIS YEAR, THE PERCENT OF STUDENTS QUALIFYING FOR TIER 2 IS 17.6% (IDEAL RANGE: 5-15%). 51% of incidents resulting in OSS involved physical contact/aggression, threats, and harassment. Of the 22 students earning 2 or more suspensions, the following sub-groups were again disproportionately represented: male, free lunch, and students of minority race. STUDENTS DEMONSTRATING NEED FOR TIER 3 SUPPORTS WERE DISPROPORTIONATELY REPRESENTATIVE OF STUDENTS WHO FALL IN SUB-GROUPS OF FREE LUNCH, MALE, AND MINORITY RACE.
GOALS Social-Emotional: Decrease the total number of ODRs by 10% Focus area: Clear, consistent PBIS system with all tiers implemented Staff-Identified Action Steps: Relational Capacity - Classroom Management Strategies - Community Building Common Language for Problem Behaviors Tier 2 System Implementation Recognizing and Addressing Bias - Disrupting Poverty Book Study Identifying and Using Strategies to Support Sub-Groups (Ruby Payne Research Based Strategies)
HOT ROCKS SEL support for students and staff Vacant positions
