College Persistence and Graduation Rates by Category
Explore the persistence and graduation rates for colleges categorized by subject area, examining key gaps among different groups such as Pell recipients, first-generation students, and genders. Visual data representation is provided for better understanding.
Download Presentation

Please find below an Image/Link to download the presentation.
The content on the website is provided AS IS for your information and personal use only. It may not be sold, licensed, or shared on other websites without obtaining consent from the author. If you encounter any issues during the download, it is possible that the publisher has removed the file from their server.
You are allowed to download the files provided on this website for personal or commercial use, subject to the condition that they are used lawfully. All files are the property of their respective owners.
The content on the website is provided AS IS for your information and personal use only. It may not be sold, licensed, or shared on other websites without obtaining consent from the author.
E N D
Presentation Transcript
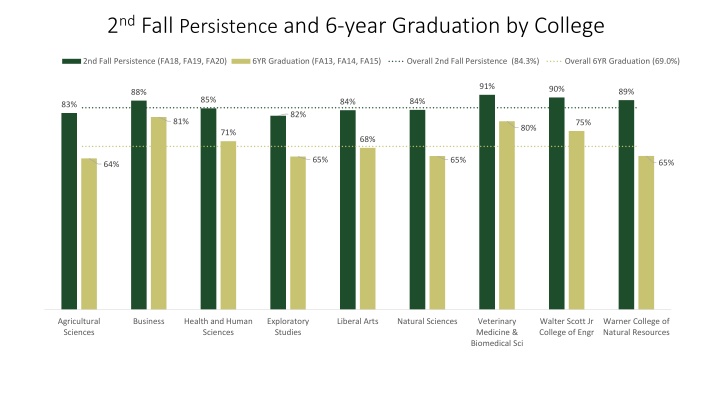
2ndFall Persistence and 6-year Graduation by College 2nd Fall Persistence (FA18, FA19, FA20) 6YR Graduation (FA13, FA14, FA15) Overall 2nd Fall Persistence (84.3%) Overall 6YR Graduation (69.0%) 91% 90% 89% 88% 85% 84% 84% 83% 82% 81% 75% 80% 71% 68% 65% 65% 65% 64% Agricultural Sciences Business Health and Human Sciences Exploratory Studies Liberal Arts Natural Sciences Veterinary Medicine & Biomedical Sci Walter Scott Jr College of Engr Warner College of Natural Resources
RM Gaps in 2ndFA Persistence and 6YR Graduation 2nd FA Persistence RM Gap 6YR Graduation RM Gap Avg RM Hdct (FA18, FA19, FA20) Avg RM Hdct (FA13, FA14, FA15) Overall 2nd FA Persistence RM gap (4.8PP) Overall 6YR Graduation RM Gap (6.7PP) RM Hdct to Close 2nd FA Gap RM Hdct to Close 6YR Gap 337 350 309 15.4 300 277 12.7 12.6 Percentage Point (PP) Difference 250 8.8 8.3 196 Headcount 200 7.5 175 6.9 6.9 171 6.5 6.2 5.5 143 150 3.9 3.6 119 114 2.9 2.3 99 87 1.4 100 1.3 74 56 56 49 42 50 32 22 2 18 17 13 12 9 8 7 7 6 4 4 4 4 3 2 1 -2.5 0 AG BU HHS ES LA NS CVMBS EG NR AG BU HHS ES LA NS CVMBS EG NR
Pell Gaps in 2ndFA Persistence and 6YR Graduation 2nd FA Persistence Pell Gap 6YR Graduation Pell Gap Avg Pell Hdct (FA18, FA19, FA20) Avg Pell Hdct (FA13, FA14, FA15) Overall 2nd FA Persistence Pell gap (6.5PP) Overall 6YR Graduation Pell Gap (11.7PP) Pell Hdct to Close 2nd FA Gap Pell Hdct to Close 6YR Gap 300 27.6 271 247 250 228 Percentage Point (PP) Difference 18.9 200 174 Headcount 15.6 14.7 140 150 13.3 127 125 121 11.5 11.4 10.1 9.9 9.5 89 8.9 100 8.6 83 7.4 61 59 58 5.5 53 4.1 39 3.7 50 36 31 2.7 27 23 6 2.1 20 18 13 12 11 10 7 6 6 5 4 4 4 3 3 3 0 AG BU HHS ES LA NS CVMBS EG NR AG BU HHS ES LA NS CVMBS EG NR
First Generation Gaps in 2ndFA Persistence and 6YR Graduation 2nd FA Persistence FG Gap 6YR Graduation FG Gap Avg FG Hdct (FA18, FA19, FA20) Avg FG Hdct (FA13, FA14, FA15) Overall 2nd FA Persistence FG Gap (6.5PP) Overall 6YR Graduation FG Gap (11.1PP) FG Hdct to Close 2nd FA Gap FG Hdct to Close 6YR Gap 344 350 20.6 284 300 Percentage Point (PP) Difference 253 18.1 250 16.1 201 13.8 Headcount 200 12.6 11.1 145 10.3 141 10.1 139 9.6 150 130 9.1 8.9 7.5 101 6.5 6.2 100 82 78 70 66 60 3.1 38 2.6 50 34 31 29 28 28 6 25 1.7 1.2 13 10 9 9 8 8 6 5 5 3 3 2 2 2 0 AG BU HHS ES LA NS CVMBS EG NR AG BU HHS ES LA NS CVMBS EG NR
Gender Gaps in 2ndFA Persistence and 6YR Graduation 2nd FA Persistence Gender Gap 6YR Graduation Gender Gap Avg Gender Hdct (FA18, FA19, FA20) Avg Gender Hdct (FA13, FA14, FA15) Overall 2nd FA Persistence Gender Gap (1.7PP) Overall 6YR Graduation Gender Gap (4.8PP) Gender Hdct to Close 2nd FA Gap Gender Hdct to Close 6YR Gap 625 9.2 600 557 8.4 Percentage Point (PP) Difference 500 6.7 421 415 400 5.8 5.6 Headcount 331 4.9 4.6 283 300 246 3.3 206 3.2 193 184 181 200 2.7 167 2.5 2.5 2.3 2.3 2.0 106 94 1.5 100 63 60 0.9 53 48 40 0 0.4 24 18 16 15 12 11 10 9 5 4 3 2 2 1 1 1 0 AG BU HHS ES LA NS CVMBS EG NR AG BU HHS ES LA NS CVMBS EG NR
Non-Resident Gaps in 2ndFA Persistence and 6YR Graduation 2nd FA Persistence Nonres Gap 6YR Graduation Nonres Gap Avg Nonres Hdct (FA18, FA19, FA20) Avg Nonres Hdct (FA13, FA14, FA15) Overall 2nd FA Persistence Nonres Gap (2.8PP) Overall 6YR Graduation Nonres Gap (5.9PP) Nonres Hdct to Close 2nd FA Gap Nonres Hdct to Close 6YR Gap 400 379 15.8 350 Percentage Point (PP) Difference 285 282 300 250 226 7.0 6.8 6.8 6.6 Headcount 6.2 5.2 5.1 199 4.6 191 188 200 3.5 3.4 3.2 173 2.3 160 2.0 2.0 156 1.5 0.7 139 150 124 123 114 83 100 80 76 45 -4.6 50 18 15 11 11 10 10 9 9 8 7 7 4 3 2 2 2 1 0 AG BU HHS ES LA NS CVMBS EG NR AG BU HHS ES LA NS CVMBS EG NR
Rural Gaps in 2ndFA Persistence and 6YR Graduation 2nd FA Persistence Rural Gap 6YR Graduation Rural Gap Avg Rural Hdct (FA18, FA19, FA20) Avg Rural Hdct (FA13, FA14, FA15) Overall 2nd FA Persistence Rural Gap (3.9PP) Overall 6YR Graduation Rural Gap (3.6PP) Rural Hdct to Close 2nd FA Gap Rural Hdct to Close 6YR Gap 100 26.0 89 90 Percentage Point (PP) Difference 80 70 61 57 60 Headcount 54 51 10.1 9.6 50 7.6 42 40 39 4.9 36 40 3.4 32 32 1.4 1.4 1.2 0.7 0.4 30 21 20 18 20 15 -0.3 -0.6 -0.7 -0.8 12 11 -1.7 9 7 2 5 10 5 2 2 0 0 0 0 0 -6.8 -7.2 0 AG BU HHS ES LA NS CVMBS EG NR AG BU HHS ES LA NS CVMBS EG NR


