Climate Projections and Data Evaluation for California
Detailed information on CMIP6 climate projections for California, evaluation of global climate models, summaries of data on the C-DAWG website, large set of CMIP6 downscaled climate projection data, and improvements in the LOCA2-Hybrid approach. The LOCA2-Hybrid method offers higher resolution training data and a more realistic depiction of California's topography. It supports a wider range of stakeholder applications, provides better projections for future decades, and enhances understanding of uncertainty, variability, and extremes.
Download Presentation

Please find below an Image/Link to download the presentation.
The content on the website is provided AS IS for your information and personal use only. It may not be sold, licensed, or shared on other websites without obtaining consent from the author.If you encounter any issues during the download, it is possible that the publisher has removed the file from their server.
You are allowed to download the files provided on this website for personal or commercial use, subject to the condition that they are used lawfully. All files are the property of their respective owners.
The content on the website is provided AS IS for your information and personal use only. It may not be sold, licensed, or shared on other websites without obtaining consent from the author.
E N D
Presentation Transcript
Evaluation of Global Climate Models for CA Krantz et al., 2021
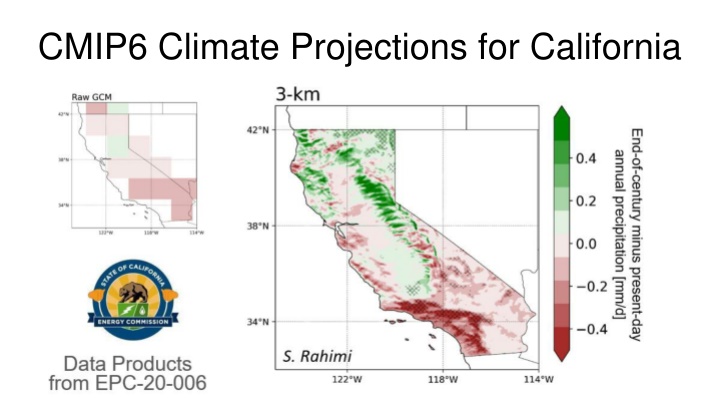
LOCA2-Hybrid: Improvements from last 4th CA Assessment Improved, higher resolution training data set New approach better depicts effects of California s topography; 3 km vs. 6 km in version 1 Uses WRF to interpolate between points Improved representation of precipitation extremes Critical for flooding and water management Hybrid downscaling scheme More realistic projections for coming decades Relaxes stationarity assumption More variables Supports a wider range of stakeholder applications Tmin, Tmax, P, 10-meter wind speed; daily min and max of relative humidity; downward solar radiation, 10-meter U, V wind components (vector wind), specific humidity More runs, multiple ensemble members (see LOCA2- Hybrid Page for details) Allows better understanding of uncertainty, natural variability, and extremes More emissions scenarios Better understanding of possible future human/societal/policy choices
LOCA2-Hybrid: New, higher resolution training data uses WRF to interpolate between stations for more realistic precipitation D. Pierce
LOCA2 Hourly Temperature Projections for Individual CEC Requested Stations Overview Projections of hourly surface temperatures from 1950-2100 at individual locations Based on LOCA method* and existing LOCA2 gridded 3km downscaled CMIP6 daily Tmax and Tmin results 33 stations 32 CA + Las Vegas station locations of importance requested by CEC demand forecast unit Includes all models from LOCA CA dataset (15 GCMs with up to 10 ensemble members each, depending on SSP2-4.5, SSP3-7.0, or SSP5-8.5) Analog matching method Better represents hourly variability compared to traditional climatological diurnal cycle approach Map of the 33 stations, 4 new stations in this version labeled red *Pierce and Cayan 2019 https://cirrus.ucsd.edu/~pierce/tmp/Hourly_data_interpolation_2019-05-23.pdf
LOCA2 Hourly Temperature Projections for Individual CEC Requested Stations (2) Projections are complete 129 total simulations for each of the 33 stations = 4,257 total What s new in Version 2 Projections based on LOCA2 (CMIP6), featuring latest generation of available models, SSP scenarios, and ensemble members compared to Version 1 4 additional stations in northern California Longer period of record for most stations from HadISD, the historical hourly temperature training data provided by Eagle Rock Analytics Method improved to better represent difference between wet vs. dry days Method improved to ensure that hourly values more closely match the input LOCA Tmax and Tmin
LOCA2-Hybrid Applications Recommend using LOCA2-Hybrid data for analyses unless dynamical downscaled data is required (e.g. hourly data, variable not available from LOCA2-Hybrid; see more detail on Slide 12) Use LOCA2-Hybrid to compare future scenarios (different SSPs) Use LOCA2-Hybrid to examine internal or natural variability using ensemble members LOCA2-Hybrid has more models so is better able to represent the possible range of future projections and capture possible extremes
Dynamical Downscaling (WRF) 26 or 21* Hourly Variables 37 Daily Variables (including IVT, evapotranspiration) All models are SSP3-70 for 3 km runs a-priori Bias Corrected Models 1. MIROC6 r11i1p1f1 2. TaiESM1 r1i1p1f1 3. EC-Earth3 r1i1p1f1 4. MPI-ESM1-2-HR r3i1p1f1 5. EC-Earth3-Veg r1i1p1f1*
Suggest using a-priori bias corrected WRF models unless implications of biases have been carefully considered and factored into analyses and results. Research indicates that the non-a-priori bias corrected models produce results that are not physically plausible. Dynamical Downscaling: Uses Apriori Bias Corrected Models 1. MIROC6 r11i1p1f1 2. TaiESM1 r1i1p1f1 3. EC-Earth3 r1i1p1f1 4. MPI-ESM1-2-HR r3i1p1f1 5. EC-Earth3-Veg r1i1p1f1 Without Bias Corrected Models 1. CESM2 r11i1p1f1 2. CNRM-ESM2-1 r1i1p1f2 3. EC-Earth3-Veg r1i1p1f1 4. FGOALS-g3 r1i1p1f1 When to use WRF dynamically downscaled projections: Need hourly data that is not temperature at station location Need data beyond CA (9 km grid - there are many 9 km simulations with bias correction) Need a variable that is not part of the LOCA2-Hybrid data set Need to capture an event with dynamical consistency across several variables
Hydrologic Simulations TWO hydrologic models: Noah-MP and VIC - 14 of the LOCA2-Hybrid Models - 13 SSP3-7.0; 4 SSP2-4.5; 4 SSP5-8.5 LOCA2 And 4 of the non-a-priori BC WRF GCMs Complete Spreadsheet linked here - - Daily output from 10/1/1954 to 09/30/2100 Example output land surface variables include: runoff, SWE, evapotranspiration Calibration for runoff performed across entire state of California - - First for basins with natural flow observations And then extended to HUC10 basins based on hydroclimate similarities between calibrated and ungauged basins Using standard measures, VIC vs Noah-MP performance similar, but varies slightly depending on time-resolution and location
Hourly Sea Level Data Hourly total water level from 1/1/1950 through 12/31/2099 for 9 locations along California coast and 4 locations in SF Bay and upper Delta shown on map, RHS. Accounts for tides, weather, and ENSO as well as long term sea level rise 11 GCMs for 3 SSPs & multiple ensemble members Provides projections corresponding to three different long term sea level rise scenarios from updated California Sea Level Rise Guidance, adopted from NOAA 2022 Report "Global and Regional Sea Rise Scenarios for the United States
Recommendations Use LOCA2-Hybrid for analyses unless WRF data is needed. Use SSP370 for analyses unless investigating impact of mitigation. Recommend using SSP245 to compare. For many investigations of changes, use one ensemble member from each GCM. For analyses of natural/internal variability, use multiple ensemble members of the same GCM and across GCMs; for example use multiple ensemble members of multiple GCMs to investigate extremes. If using WRF data, prioritize a-priori bias corrected model projections unless other (non-a-priori bias corrected) WRF simulations are warranted and implications of biases have been carefully considered. Determine time periods depending on application (e.g. planning horizon, risk threshold, etc) Evaluate both hydrologic models, considering the location and time resolution. Similar to weather variables, use multiple hydrological model projections to capture uncertainty.
