City of Vista 2017 Districting Draft Maps and Election Systems Overview
The City of Vista in 2017 is undergoing districting, with draft maps created by National Demographics Corporation. The process includes community forums, council hearings, and election sequencing. Various election systems, including by-district and at-large, are discussed along with the impact of the California Voting Rights Act. The importance of districts in ensuring fair representation and the legal implications are highlighted.
Download Presentation

Please find below an Image/Link to download the presentation.
The content on the website is provided AS IS for your information and personal use only. It may not be sold, licensed, or shared on other websites without obtaining consent from the author.If you encounter any issues during the download, it is possible that the publisher has removed the file from their server.
You are allowed to download the files provided on this website for personal or commercial use, subject to the condition that they are used lawfully. All files are the property of their respective owners.
The content on the website is provided AS IS for your information and personal use only. It may not be sold, licensed, or shared on other websites without obtaining consent from the author.
E N D
Presentation Transcript
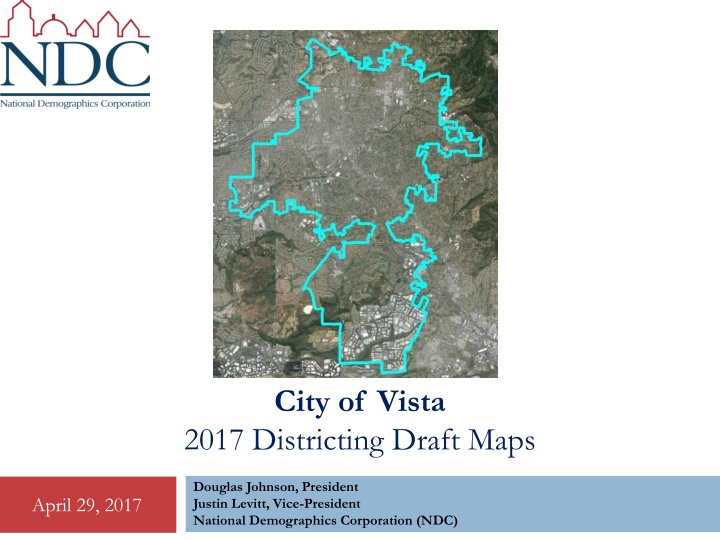
City of Vista 2017 Districting Draft Maps Douglas Johnson, President Justin Levitt, Vice-President National Demographics Corporation (NDC) April 29, 2017
Remaining Schedule Date Event April 29 Three Community Forums: Morris B. Vance Community Room, Rancho Buena Vista High, and Linda Rhoades Neighborhood Center Council Hearing at which the public is invited to provide input regarding the content of the draft map or maps and the proposed sequence of elections 2ndCouncil Hearing at which the public is invited to provide input regarding the content of the draft map or maps and the proposed sequence of elections. Public Hearing on action item and Council votes to select a map, propose election sequencing, and introduce ordinance. 2nd reading and final adoption of ordinance May 18 & May 30 June 13 June 27 November 2018 First two districts hold elections (plus at-large Mayoral election) Remaining two districts hold elections November 2020 April 29, 2017
Election Systems At Large 1. From District or Residence Districts 2. By District 3. Charter City variants: cumulative, limited, Ranked Choice, etc. 4. The California Voting Rights Act was written to specifically require by-district elections. April 29, 2017
Why Districts? By-District Election At-Large Election 30 majority voters 30 majority voters 100 majority voters 10 majority voters 30 majority voters 20 opposition voters 20 opposition voters When one voting bloc significantly outnumbers another, the majority wins every at-large seat. But if the smaller group is geographically concentrated, it can elect someone who shares their views to the Council or Board. April 29, 2017
CVRA Impact Signed into law by Gov. Gray Davis in 2002 Key decisions & settlements Only Palmdale has gone to trial on the merits (the city lost) Suspended by Superior Court ruling in the Modesto case, but reinstated by appeals court in 2006. Key settlements: Palmdale: $4.7 million Modesto: $3 million Anaheim: $1.1 million Switched (or in the process of switching) as a result of CVRA: Whittier: $1 million Santa Barbara: $600,000 At least 137 school districts Tulare Hospital: $500,000 Madera Unified: about $170,000 27 Community College Districts Hanford Joint Union Schools: $118,000 47 cities 1 County Board of Supervisors Merced City: $42,000 8 water and other special districts. Placentia: $20,000 April 29, 2017
Districting Rules and Goals Federal Laws Traditional Criteria Equal Population Communities of interest Compact Contiguous Visible (Natural & man-made) boundaries Respect for voters wishes and continuity in office (avoiding pairing that results in head to head contests) Planned future growth FederalVoting Rights Act No Racial Gerrymandering April 29, 2017
Race/Ethnic Profile Total Population Latino NH White NH Black/African-American NH Native American NH Asian-American NH Pacific Islander NH Other NH Multi-Race Voting Age Population total VAP Latino VAP NH White VAP NH Black/African-American VAP NH Native American VAP NH Asian-American VAP NH Pacific Islander VAP NH Other VAP NH Multi-Race Citizen VAP total CVAP Latino CVAP NH White CVAP NH African-American CVAP NH Asian & Pacific Islander CVAP Other (incl. Nat. Amer. & Pac. Isl.) Voter Registration (Nov. 2014) Latino Reg Asian-Surnamed Reg. Filipino-Surnamed Reg. Voters Casting Ballots (Nov. 2014) Latino voters Asian-Surnamed voters Filipino-Surnamed voters Voters Casting Ballots (Nov. 2012) Latino voters Asian-Surnamed voters Filipino-Surnamed voters Count 93,834 45,380 38,287 3,188 642 4,709 775 236 617 68,760 28,829 32,302 2,302 503 3,709 574 168 373 57,002 16,754 34,038 2,034 3,540 636 37,824 9,950 824 399 15,382 2,454 311 118 26,985 5,604 561 242 Percent ACS Profile ACS Total Population 48% Age 0 - 19 41% Age 20 - 60 3% Age 60+ 1% Age 65+ 5% Immigrant 1% Naturalized 0% Age 5+ 1% Speaks English at home Speaks Spanish at home 42% Speaks an Asian language at home 47% Speaks other language at home 3% Speaks English only "well" or less 1% Age 25+ 5% Age 25+, no HS degree 1% Age 25+, HS degree (only) 0% Age 25+, bachelor degree (only) 1% Age 25+, graduate degree (only) Households 29% Child under 18 in Household 60% Income $0-25k 4% Income $25-50k 6% Income $50-75k 1% Income $75-200k Income $200k+ 26% Housing units 2% Single-Family 1% Multi-Family 41% Vacant 16% Occupied 2% Rented 1% Owned 73% 36% 4% 2% Count 94,966 24,108 56,198 14,660 10,179 23,605 7,583 88,693 51,219 32,039 3,240 2,195 25,550 61,977 14,349 35,624 8,407 3,597 30,336 9,343 6,559 8,678 5,695 8,530 874 31,749 21,055 10,694 1,413 30,336 14,731 15,604 Percent 1% 25% 59% 15% 11% 25% 32% Demographic Summary 58% 36% 4% 2% 29% 23% 57% 14% 6% 31% 22% 29% 19% 28% 3% Each of the 4 districts needs about 23,500 people (the total population, 93,834, divided by the number of districts). 66% 34% 4% 96% 49% 51% April 29, 2017
Latino Population Total Population Citizen Voting Age Population Latinos are concentrated North and West of Vista Way, but a much larger share of total population than of citizen voting age population (CVAP). There are no concentrations of other protected classes large enough to impact the drawing of district lines. April 29, 2017
Defining Communities of Interest A Community of Interest (COI) is a neighborhood or community that would benefit from being maintained in a single district because of shared interests, views, or characteristics. Possible community feature/boundary definitions include: School Attendance Areas City borders Natural neighborhood dividing lines, such as highway or major roads, rivers, canals, and/or hills Areas around parks and other neighborhood landmarks Common issues, neighborhood activities, or legislative/election concerns Shared demographic characteristics Such as similar levels of income, education, or linguistic isolation Ancestry (Not race or ethnicity) April 29, 2017
Green Draft Drawn primarily based on compactness, neighborhoods, and, where possible, sharing borders with Vista Unified trustee areas. Election Years: 2018: Districts A and D 2020: Districts B and C 50.3% of eligible voters in District A are Latino, as are 36% in District B (measured by CVAP). April 29, 2017
Purple Draft Drawn primarily based on neighborhoods, major roads and, where possible, sharing borders with Vista Unified trustee areas. Election Years: 2018: Districts A and D 2020: Districts B and C 51% of eligible voters in District A are Latino, as are 35% in District B (measured by CVAP). April 29, 2017
Discussion What do you like and dislike about Green and/or Purple April 29, 2017
