Changing Trends in Cuban-American Voter Ideology
Explore the evolving political ideology of Cuban-American voters from 1991 to 2011 through data on migration, residency, naturalization, and political exceptionalism. Uncover how these trends have influenced Miami's Latino demographics and the Cuban perspective on US/Cuba relations.

Uploaded on Sep 16, 2024 | 0 Views
Download Presentation

Please find below an Image/Link to download the presentation.
The content on the website is provided AS IS for your information and personal use only. It may not be sold, licensed, or shared on other websites without obtaining consent from the author.If you encounter any issues during the download, it is possible that the publisher has removed the file from their server.
You are allowed to download the files provided on this website for personal or commercial use, subject to the condition that they are used lawfully. All files are the property of their respective owners.
The content on the website is provided AS IS for your information and personal use only. It may not be sold, licensed, or shared on other websites without obtaining consent from the author.
E N D
Presentation Transcript
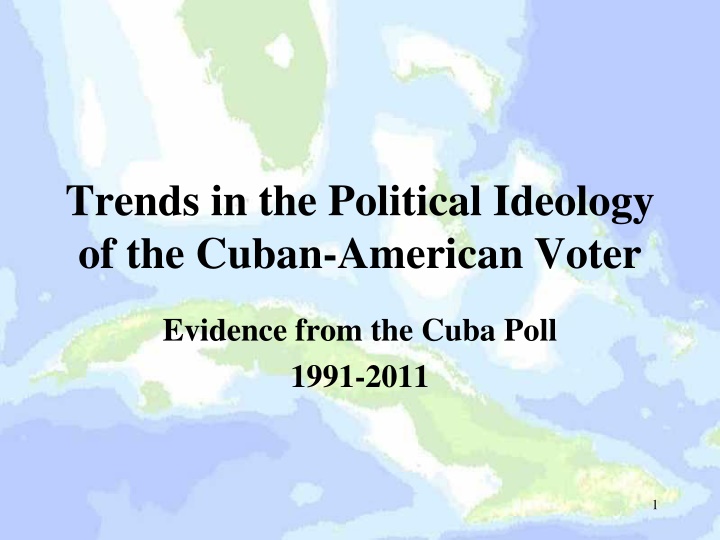
Trends in the Political Ideology of the Cuban-American Voter Evidence from the Cuba Poll 1991-2011 1
Social Dimensions of Change in Cuban Miami Institutions population culture Social organization Demographic Changes Ideologies Norms Values Beliefs Groups Classes Stratification Politics Religious Kinship Education Economy 2
Next Few Minutes Trends in Cuban Migration, Residency and Naturalization. How these trends have shaped Miami s Latino demographics. How these trends have shaped Cuban political ideology on US/Cuba relations. Final note on Cuban-American political exceptionalism. You should walk away with a sense of the changing nature of Cuban voter opinion towards US/Cuba Relations and the forces that are ineluctably creating the changes. 3
Cubans Receiving Permanent Resident Status by Decades 300,000 271,742 256,497 250,000 202,030 200,000 159,037 132,552 150,000 102,644 100,000 73,221 50,000 12,769 10,64125,976 0 4
Cubans Naturalized 2003-2012 45,000 39,871 40,000 35,000 31,244 30,000 24,891 25,000 21,481 21,071 20,000 15,394 14,050 15,000 11,236 11,227 7,698 10,000 5,000 0 5 2003 2004 2005 2006 2007 2008 2009 2010 2011 2012
Comparative Rates of Naturalization of Selected Latino Groups 2003-2012 45,000 39,871 40,000 33,351 35,000 30,000 Colombia Cuba Dominican Republic Honduras Venezuela 25,000 22,693 20,000 15,000 8,794 10,000 7,404 5,000 6 0 2003 2004 2005 2006 2007 2008 2009 2010 2011 2012
Latino Origin Population Percent of Total Population (2% or more) 2010 40.0% 35% 35.0% 30.0% 25.0% 20.0% 15.0% 10.0% 4.6% 4.2% 3.7% 2.3% 2.2% 5.0% 2.1% 0.0% 7
Non- Hispanic African descent 425,650 17% Haitian 120,000 AA Cuban 860,000 35% Other Hispanic 31% Miami 2,496,435 CA Car 212,542 150,000 >1994 301,000 35% <1994 559,00 65% 1994 > Other 142,000 SA 273,542 Anglo 383,551 15%
1990 Polls vs 2000 Polls Average of Responses Support for Embargo and Support for Dialogue 100% 90% 84% 80% Embargo Support 70% 60% Cuban Pop: 650,000 (2000 Census) 60% 58% 50% 46% 40% Dialogue Support Cuban Pop: 856,000 (2010 Census) 30% 20% 10% 0% 1998 2000 2002 2004 2006 2008 2010 2012 2014 9
Establishing a Dialogue 70% 65% 58% 60% 51% Mar-91 Oct-91 Jun-93 Mar-95 Jun-97 Oct-00 Mar-04 Mar-07 Sep-11 50% 43% 40% 40% 35% 30% 20% 10% 0% 10 Strongly/Mostly Favor Strongly/Mostly Oppose
Favor Continuing Embargo 100% 87% 90% 78% 80% Mar-91 Oct-91 Jun-93 Mar-95 Jun-97 Oct-00 Mar-04 Mar-07 Nov-08 Sep-11 70% 62% 60% 56% 50% 45% 40% 30% 20% 10% 0% 11 Favor
Do you think that the United States should continue the trade embargo with Cuba or should the United States end the trade embargo and permit normal trade with Cuba? 70% 59% 60% 49% 48% 50% 38% 40% 30% Continue Embargo End the Embargo 20% 10% 0% Source: WPO 2009 12
1990 Polls vs 2000 Polls Average of Responses Support for Selling Medicines and Unrestricted Travel 90% Selling Medicine 80% Cuban Pop: 650,000 71% 70% SellingMedicine 60% 56% 57% 50% 43% Unrestricted Travel 40% 30% UnrestrictedTravel Cuban Pop: 856,000 20% 10% 0% 1998 2000 2002 2004 2006 2008 2010 2012 2014 13
Allow companies to sell medicine to Cuba? 60% 48% 50% Jun-93 Mar-95 Jun-97 Oct-00 Mar-04 Mar-07 11-Sep 40% 33% 33% 31% 29% 30% 27% 27% 19% 20% 16% 12% 9% 8% 10% 0% 14 Strongly Favor Mostly Favor Mostly Oppose Strongly Oppose
Allow companies to sell food to Cuba? 60% 55% 50% 42% Jun-93 Mar-95 Jun-97 Oct-00 Mar-04 Mar-07 11-Sep 40% 30% 24% 23% 20% 15% 11% 10% 8% 10% 0% 15 Strongly Favor Mostly Favor Mostly Oppose Strongly Oppose
Should unrestricted travel from U.S. to Cuba be allowed (for all Americans)? 80% 68% 70% 60% 57% Mar-91 Oct-91 Jun-93 Mar-95 Oct-00 Mar-04 Mar-07 8-Nov 11-Sep 55% 53% 50% 50% 46% 44% 40% 40% 37% 30% 20% 10% 0% 16 Favor
Should unrestricted travel by all Americans to Cuba be allowed or not? 80% 75% 73% 70% 63% 60% 49% 50% Total Registered After 94 18-44 Cuban-Am 37% 40% 27% 30% 25% 20% 10% 0% 17 YES, ALLOWED NO, NOT ALLOWED
Do you favor or oppose the U.S. re-establishing diplomatic relations with Cuba? 80% 76% 71% 70% 70% 58% 60% 51% 49% 50% Total Registered After 94 18-44 Cuban-Am 42% 40% 30% 29% 30% 24% 20% 10% 0% 18 favor oppose
Do you favor or oppose continuing the U.S. embargo of Cuba? 70% 64% 60% 57% 56% 53% 50% 47% 44% 43% Total Registered After 94 18-44 Cuban-Am 40% 36% 30% 20% 10% 0% 19 FAVOR OPPOSE
Registered as Republican, Democrat or Independent? 80% 70% 70% 60% 56% 52% Mar-91 Oct-91 Mar-04 Mar-07 Mar-08 11-Sep 50% 40% 30% 27% 23% 21% 20% 20% 16% 14% 10% 0% 20 Republican Democrat Independent
Voter Registration Cubans in Miami 2011 100% 93% 90% 80% 67% 70% 59% 60% 54% Total After 94 18-44 Cuban-Am 50% 39% 35% 40% 27% 30% 20% 7% 6% 6% 5% 10% 0% non-citizen citizen not registered citizen registered 21
Among Multiple Identities- What is The Primary Identification among Latino Sub-Groups Latino sub-groups in Florida American National Origin Pan-ethnic (Latino) 38.4% Cuban 27.0% 24.9% Puerto Rican 21.1 28.9 46.4 Mexican 7.8 36.4 47.3 Dominican 12.8 32.1 44.9 South American 24.5 32.7 34.7 Central American 22.5 43.7 29.6 Statistically significant @.055
LATINO GROUP PERCEPTIONS OF SOCIO-ECONOMIC COMMONALITIES Thinking about issues like job opportunities, education or income, how much do your ethnic subgroup have in common with other Latinos or Hispanics? Would you say [ethnic subgroup] share a lot in common, some things in common, little in common, or nothing in common with other Latinos? LATINO SUB-GROUPS IN FLORIDA Cubans NONE/ LITTLE SOME/ A LOT 18.2% 71.2% Puerto Ricans 13.2 80.2 Mexicans 19.4 72.1 Dominicans 14.1 80.7 South Americans 15.3 77.6 Central Americans 15.5 80.3 NOT STATISTICALLY SIGNIFICANT
LATINO GROUP PERCEPTIONS OF POLITICAL COMMONALITIES Now thinking about things like government services and employment, political power and representation, how much do [ethnic subgroup] have in common with other Hispanics or Latinos? Would you say [ethnic subgroup] share a lot in common, some things in common, little in common, or nothing in common with other LATINO SUB-GROUPS IN FLORIDA Cubans NONE/ LITTLE SOME/ A LOT 18.6% 78.7% Puerto Ricans 22.3 71.0 Mexicans 27.9 60.5 Dominicans 23.0 67.9 South Americans 34.7 56.2 Central Americans 33.8 59.2 Statistically significant @<.05