Cancer Mortality Rates and Spending Insights
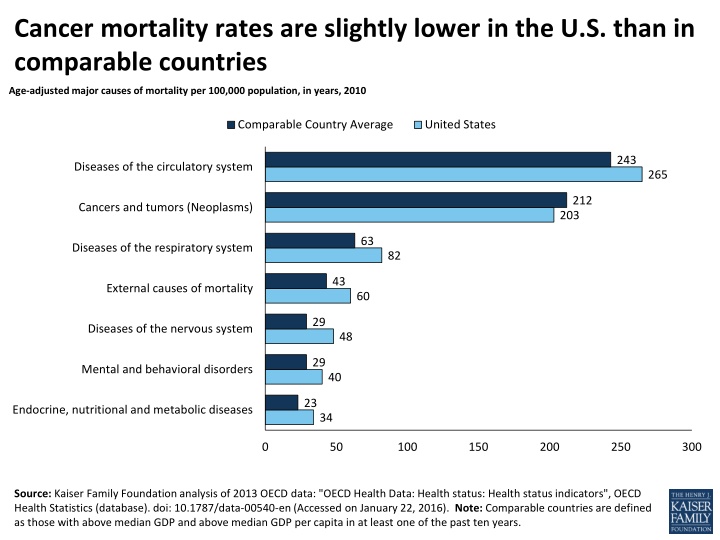
Cancer mortality rates in the U.S. are slightly lower compared to other countries, with circulatory diseases and cancers being major causes of mortality. Lung cancer is a significant contributor to disease burden, especially among males. Despite cancer accounting for 7% of health expenditures, it was not a leading driver of medical services spending growth from 2000-2012.
Download Presentation

Please find below an Image/Link to download the presentation.
The content on the website is provided AS IS for your information and personal use only. It may not be sold, licensed, or shared on other websites without obtaining consent from the author.If you encounter any issues during the download, it is possible that the publisher has removed the file from their server.
You are allowed to download the files provided on this website for personal or commercial use, subject to the condition that they are used lawfully. All files are the property of their respective owners.
The content on the website is provided AS IS for your information and personal use only. It may not be sold, licensed, or shared on other websites without obtaining consent from the author.
E N D
Presentation Transcript
Cancer mortality rates are slightly lower in the U.S. than in comparable countries Age-adjusted major causes of mortality per 100,000 population, in years, 2010 Comparable Country Average United States 243 Diseases of the circulatory system 265 212 Cancers and tumors (Neoplasms) 203 63 Diseases of the respiratory system 82 43 External causes of mortality 60 29 Diseases of the nervous system 48 29 Mental and behavioral disorders 40 23 Endocrine, nutritional and metabolic diseases 34 0 50 100 150 200 250 300 Source: Kaiser Family Foundation analysis of 2013 OECD data: "OECD Health Data: Health status: Health status indicators", OECD Health Statistics (database). doi: 10.1787/data-00540-en(Accessed on January 22, 2016). Note: Comparable countries are defined as those with above median GDP and above median GDP per capita in at least one of the past ten years.
Lung cancer is the largest contributor to disease burden among cancers for both males and females MALES FEMALES Age standardized disability adjusted life years (DALYs) rate per 100,000 population, males in the U.S., 2013 Age standardized disability adjusted life years (DALYs) rate per 100,000 population, females in the U.S., 2013 Lung and related 980 Lung and related 639 Prostate 366 Breast 517 Colon and rectal 364 Colon and rectal 249 Pancreatic 220 Ovarian 164 Other neoplasms 183 Pancreatic 158 Leukemia 170 Other neoplasms 151 Non-Hodgkin lymphoma 167 Leukemia 102 Liver 145 Non-Hodgkin lymphoma 97 Brain and nervous system 143 Brain and nervous system 91 Esophageal 133 Cervical 86 - 400 800 1,200 - 500 1,000 Source: Institute for Health Metrics and Evaluation. Global Burden of Disease Study Data Downloads, available here: http://ghdx.healthdata.org/global-burden-disease-study-2013-gbd-2013-data-downloads (Accessed May 11, 2016)
Cancer spending accounts for about 7% of disease-based health expenditures Total expenditures in US $ billions by disease category, 2012 Pregnancy, birth - $39 Dermatological - $44 Other - $93 Infectious diseases - $67 Ill-defined conditions - $247 Mental Illness - $80 Circulatory, $243 Digestive - $107 Genitourinary - $113 Musculoskeletal, $188 Injury - $118 Respiratory, $158 Nervous system - $133 Endocrine - $138 Cancers - $124 Source: Bureau of Economic Analysis Health Care Satellite Account (Blended Account) and National Health Expenditure Data Note: Spending on dental services, nursing homes, and prescriptions that cannot be allocated to a specific disease not included above. Data last updated January 25, 2016.
While Cancer is one of the top contributors to disease burden, it was not a leading driver of medical services spending growth from 2000-2012 Contribution to medical services expenditure growth, by disease, 2000-2012 Ill-defined conditions 16.6% Musculoskeletal 11.0% Circulatory 8.6% Endocrine 8.5% Nervous system 7.4% Respiratory 6.5% Cancer 6.3% Other 6.2% Genitourinary 5.9% Injury and poisoning 5.3% Digestive 5.1% Infectious diseases 4.4% Mental illness 4.1% Dermatological 2.3% Pregnancy/childbirth 1.7% 0% 2% 4% 6% 8% 10% 12% 14% 16% 18% Source: Kaiser Family Foundation analysis of Bureau of Economic Analysis Health Care Satellite Account (Blended Account) Note: Expenditures on nursing home and dental care are not included in health services spending by disease. Data last updated January 25, 2016.
Average growth in per capita spending for cancer was slightly lower than the average for all disease categories Average annual growth in expenditures by disease category (per capita), price index by disease category (cost to treat each case), and real expenditures by disease category (number of treated cases), 2000 - 2012 Cancer All diseases 6.0% 5.4% 5.0% 5.0% 4.6% 4.4% 4.0% 3.0% 1.9% 2.0% 1.3% 1.0% 0.0% Spending per capita Cost to treat each case Number of treated cases Source: Kaiser Family Foundation analysis of Bureau of Economic Analysis Health Care Satellite Account (Blended Account) Note: Expenditures on nursing home and dental care are not included in health services spending by disease. Data last updated January 25, 2016.
Cancer medications were among the top 3 conditions for specialty drug spending in 2015 Express Scripts per-member-per-year spending, top 10 specialty therapy class drugs, 2015 Inflammatory conditions $89.10 Multiple Sclerosis $53.31 Oncology $49.62 Hepatitis C $38.44 HIV $31.53 Growth Deficiency $7.12 Cystic fibrosis $6.64 Pulmonary hypertension $5.85 Hemophilia $5.79 Sleep disorders $4.57 $0 $10 $20 $30 $40 $50 $60 $70 $80 $90 $100 Source: Express Scripts 2015 Drug Trend Report
