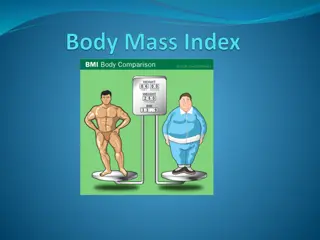
BMI Gauge Example Using Javascript and SVG


408/508
Computational
Techniques for Linguists
Lecture 16

Today's Topic
•
BMI Gauge animated display example
•
using <form> elements
•
using <table>
•
using Javascript to compute BMI value
•
using the gaugeSVG.js widget to display the BMI value
•
Homework 7:
•
use the Gauge!
BMI:
<form>… </form>
File:
bmi-js.html
"weight"
"height"
"units"
"output" is (currently)
an empty division
BMI: Javascript function
computeBMI()
File:
bmi-js.html
computeBMI(this)
e.form.weight.value
e.form.height.value
e.form.units[0].checked
0 = 1
st
radio button
BMI:
gaugeSVG.js
http://www.codeproject.com/Articles/604502/A-universal-gauge-for-your-web-dashboard
bmi-gauge.html
Download
gaugeSVG.js
from the course webpage
(
I've modified the original code a bit
)
BMI:
gaugeSVG.js
•
Note
: I
've modified his code slightly to allow for different colors for
lower and upper warning ranges
BMI:
gaugeSVG.js
BMI:
gaugeSVG.js
BMI:
<table>… </table>
<table>
BMI:
new GaugeSVG()
BMI:
new GaugeSVG()
(
lowerWarningLimit
)
18.5
25 (
upperWarningLimit
)
30 (
upperActionLimit
)
""
To set the value:
gauge.refresh(bmi, true);
see animation?
true
|
false
bmi-gauge.html
window.onload()
•
https://developer.mozilla.org/en-US/docs/Web/API/Window/load_event
JustGage
•
gaugeSVG author cites JustGage as inspiration.
https://toorshia.github.io/justgage/
Raphaël Javascript graphics library
https://dmitrybaranovskiy.github.io/raphael/
JustGage
•
copy
raphael-2.1.4.min.js
and
justgage.js
into the current directory where
you have your
.html
file
•
inside directory examples, there is a simple file
counter.html
•
I've modified it slightly to refer to the .js files for the same directory
•
and simplified the code
counter.html
JustGage
•
justgage.js
Homework 7
•
Example:
Homework 7
•
Use either the gaugeSVG.js or the JustGage widget
•
Write a html page that generates 100 random whole numbers
between 1,2,…,12 when a button is clicked
•
Hint
: recall tic-tac-toe code
Math.floor(Math.random()*
n
)+1
•
Displays 3 gauges that counts the total number for ranges 1-4, 5-8, 9-
12
•
Hint: use three totals, one for each range, each a variable initialized to 0.
•
refresh the appropriate gauge when its total is incremented
DOMContentLoaded
•
https://developer.mozilla.org/en-US/docs/Web/API/Document/DOMContentLoaded_event
Homework 7
•
Email to me
•
Subject: 408/508 Homework 7
YOUR NAME
•
Due date: Sunday midnight
•
A PDF file (showing screenshots)
•
Attachment: your .html file so I can test it
Today's lecture focuses on implementing a BMI gauge animated display using form elements and Javascript to compute BMI values. The gaugeSVG.js widget is utilized to visually represent the BMI. Homework includes using the modified GaugeSVG.js code to enable different color ranges for warning levels. The process involves computing BMI via a Javascript function and refreshing the gauge display accordingly. Various images and code snippets illustrate the steps involved in setting up the BMI gauge using table elements and the GaugeSVG library.

Download Presentation

Please find below an Image/Link to download the presentation.
The content on the website is provided AS IS for your information and personal use only. It may not be sold, licensed, or shared on other websites without obtaining consent from the author.If you encounter any issues during the download, it is possible that the publisher has removed the file from their server.
You are allowed to download the files provided on this website for personal or commercial use, subject to the condition that they are used lawfully. All files are the property of their respective owners.
The content on the website is provided AS IS for your information and personal use only. It may not be sold, licensed, or shared on other websites without obtaining consent from the author.
E N D
Presentation Transcript
408/508 Computational Techniques for Linguists Lecture 16
Today's Topic BMI Gauge animated display example using <form> elements using <table> using Javascript to compute BMI value using the gaugeSVG.js widget to display the BMI value Homework 7: use the Gauge!
BMI: <form> </form> "weight" "height" "units" "output" is (currently) an empty division File: bmi-js.html
BMI: Javascript function computeBMI() File: bmi-js.html e.form.weight.value e.form.height.value e.form.units[0].checked 0 = 1st radio button computeBMI(this)
BMI: gaugeSVG.js http://www.codeproject.com/Articles/604502/A-universal-gauge-for-your-web-dashboard bmi-gauge.html Download gaugeSVG.js from the course webpage (I've modified the original code a bit)
BMI: gaugeSVG.js Note: I've modified his code slightly to allow for different colors for lower and upper warning ranges
BMI: <table> </table> <table>
BMI: new GaugeSVG() 25 (upperWarningLimit) (lowerWarningLimit) To set the value: gauge.refresh(bmi, true); 30 (upperActionLimit) 18.5 see animation? true|false ""
window.onload() https://developer.mozilla.org/en-US/docs/Web/API/Window/load_event
JustGage gaugeSVG author cites JustGage as inspiration. https://toorshia.github.io/justgage/
Raphal Javascript graphics library https://dmitrybaranovskiy.github.io/raphael/
JustGage copy raphael-2.1.4.min.js and justgage.js into the current directory where you have your .html file inside directory examples, there is a simple file counter.html I've modified it slightly to refer to the .js files for the same directory and simplified the code
JustGage justgage.js
Homework 7 Example:
Homework 7 Use either the gaugeSVG.js or the JustGage widget Write a html page that generates 100 random whole numbers between 1,2, ,12 when a button is clicked Hint: recall tic-tac-toe code Math.floor(Math.random()*n)+1 Displays 3 gauges that counts the total number for ranges 1-4, 5-8, 9- 12 Hint: use three totals, one for each range, each a variable initialized to 0. refresh the appropriate gauge when its total is incremented
DOMContentLoaded https://developer.mozilla.org/en-US/docs/Web/API/Document/DOMContentLoaded_event
Homework 7 Email to me Subject: 408/508 Homework 7 YOUR NAME Due date: Sunday midnight A PDF file (showing screenshots) Attachment: your .html file so I can test it


")


")
")

")