Biomarker Rates of Change in Autosomal Dominant vs. Sporadic Alzheimer Disease
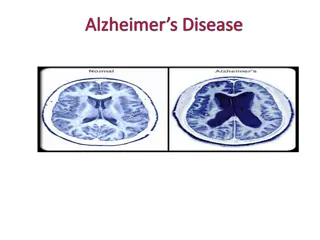
Autosomal Dominant Alzheimer Disease (ADAD) and Sporadic Late Onset Alzheimer Disease (LOAD) show distinct clinical presentations, neuropathological features, and rates of progression. The DIAN-ADNI Comparison Study aims to investigate if ADAD and LOAD share the same pathophysiology and how they respond to mechanism-based therapies. Analytic challenges include adjusting for age differences between cohorts and addressing neuropathological heterogeneity in AD cases.

Download Presentation

Please find below an Image/Link to download the presentation.
The content on the website is provided AS IS for your information and personal use only. It may not be sold, licensed, or shared on other websites without obtaining consent from the author.If you encounter any issues during the download, it is possible that the publisher has removed the file from their server.
You are allowed to download the files provided on this website for personal or commercial use, subject to the condition that they are used lawfully. All files are the property of their respective owners.
The content on the website is provided AS IS for your information and personal use only. It may not be sold, licensed, or shared on other websites without obtaining consent from the author.
E N D
Presentation Transcript
AAIC 2018 Biomarker Rates of Change in Autosomal Dominant Versus Sporadic Alzheimer Disease John C. Morris, MD On behalf of MW Weiner, L Beckett, T Benzinger, D Coble, AM Fagan, BA Gordon, P Massoumzadeh, L McCue, N Saito, L Shaw, C Xiong, VD Buckles, and all Dominantly Inherited Alzheimer Network (DIAN) and Alzheimer Disease Neuroimaging Initiative (ADNI) Investigators
Disclosures The DIAN-ADNI Comparison Study is funded by: Alzheimer s Association Anonymous Foundation National Institute on Aging Alzheimer Disease Neuroimaging Initiative, U19 AG024904 Dominantly Inherited Alzheimer Network, UF1 AG032438 Roche Diagnostics (Elecsys) JCM has no pertinent disclosures
Autosomal Dominant AD (ADAD) & Sporadic Late Onset AD (LOAD) Both ADAD and LOAD have altered A 42homeostasis: LOAD is characterized by underclearance of A 42 (Patterson et al., Ann Neurol, 2015) ADAD mutations result in relative A 42overproduction (St. George-Hyslop, Biol Psychiatry, 2000; Potter et al., Sci Trans Med, 2013) If ADAD and LOAD share the same pathophysiology, will their clinical and pathological phenotypes be similar and will they respond similarly to mechanism-based therapies? ADNI (since 2004) and DIAN (since 2008) are multi-center, international studies using multimodal biomarkers to study sporadic late-onset AD (ADNI) and autosomal dominant AD (DIAN)
ADAD Compared to LOAD Measure ADAD LOAD Clinical presentation Amnestic predominant Memory, frontal/executive, generalized cognitive decline Amyloid plaques & tau tangles > Lewy bodies Hippocampal and whole brain atrophy Hippocampal & whole brain atrophy Cortex plus basal ganglia Parieto-occipital hypometabolism Decreased by 50% Increased by 2-fold Mid-life or Early onset ~ 9.7 years Amnestic predominant Memory, frontal/executive, generalized cognitive decline Amyloid plaques & tau tangles > Lewy bodies > TDP-43 > Other Cognitive deterioration Pathology Identity and sequence MRI PIB PET FDG PET CSF A 42 CSF tau Symptom onset Disease duration Cortex Parieto-occipital hypometabolism Decreased by 50% Increased by 2-fold Late-life or Late onset ~ 8-10 years Some mutations produce additional symptoms including seizures, spastic paraparesis and extrapyramidal signs.
Analytic Challenges Age When cohort age ranges do not overlap, adjusting for age can be done within each cohort but not between the two cohorts In response, the cohorts were anchored on dementia progression using CDR-SumBox (SB) 1 to permit cognitive test results to serve as outcome measures; participants were aligned on CDR-SB=1 to compare rates of change before and after this anchor point Neuropathological Heterogeneity AD rarely occurs in isolation in ADNI s older adults1 (e.g., TDP43, vasculopathy/infarcts, synucleinopathy, hippocampal sclerosis) whereas DIAN cases (with the exception of synucleinopathy) have pure AD2 Mutation-dependent pathology in DIAN (e.g., PSEN1 mutations before codon 200 of APP have greater amyloid burden than mutations after codon 2003) PSEN mutations affect many other proteins that are secretase substrates4 1Boyle PA et al, Ann Neurol; 2018; 83:74-83 2Cairns NJ et al, Neuropathol 2015; 35:390-400 3Mann DM et al, Am J Pathol 2001; 158:2165-75 4Roher AE et al, J Alz Dis 2016; ;50:645-58
Analytic Challenges Contd Variable methods confound comparisons Different amyloid PET tracers, different imaging pipelines DIAN uses PiB, ADNI uses AV45 (some PiB in the past) Solution: Reprocess imaging data with conversion equation (Centiloid) CSF analytic variability (lot to lot and plate to plate); A 42 assay drift1 Solution: Reprocess CSF with Roche Elecsys automated platform for CSF analytes (A 42, A 40, tau, p-tau) Shaw (ADNI Biomarker Core) and Fagan (DIAN Biomarker Core) designed additional analyses to obtain mass spectrometry measures of A isoforms and important methodological comparisons (AlzBio3) 1Schindler SE et al., Alzheimers Dement. 2017;S1552-5260(17):32516-5
Anchoring Cohorts at CDR-SB1 ADNI - Age at symptomatic onset unavailable for the ADNI cohort unless progression occurred from CDR-SB=0 to CDR-SB 1. Otherwise, age of onset is estimated (See below) DIAN Age at onset is available for all by observation, extrapolation, or estimation (See below) ADNI (n=559) Any clinical group (CN-MCI-AD) at baseline Baseline amyloid PET At least a 1-point increase in the CDR-SB with follow-up in CN/MCI DIAN (n=291) All mutation carriers, symptomatic and asymptomatic 224 PSEN1, 45 APP, 22 PSEN2 Baseline CDR-SB 1 Age when actual CDR-SB 1 Age when actual CDR-SB 1 Age extrapolated using the estimated rate of change in CDR-SB from a mixed effect model Not Applicable all CN/MCI had to have CDR-SB change by 1 Age extrapolated using the estimated rate of change in CDR-SB from a mixed effect model Estimated mutation-specific age of onset (or parental age of onset) Baseline CDR-SB > 1 CDR-SB remained < 1
Cohort Baseline Description DIAN Mutation Carriers N= 291 ADNI Participants N=559 Asymptomatic Symptomatic DIAN vs ADNI CDR=0 p DIAN vs ADNI CDR>0 p Asymptomatic CDR=0 N=72 (13%) Symptomatic CDR>0 N=487 (87%) CDR=0 CDR>0 N=184 N=107 (63%) 33.4 (8.7) (37%) 46.0 (10.0) <.0001 <.0001 Age, Years, Mean (SD) 75.2 (5.6) 73.6 (7.6) 57.6 51.4 0.3647 0.0232 Sex (% Women) 51.4 39.4 88.0 92.5 0.2465 0.2108 Race (% Caucasian) 93.1 95.5 14.8 (2.9) 13.4 (3.1) 0.0006 <.0001 Education, Years, Mean (SD) 16.1 (2.8) 15.9 (2.8) 29.1 (1.2) 22.5 (6.9) 0.9721 <.0001 MMSE, Mean (SD) 29.1 (1.0) 26.1 (2.8) APOE4+ 1 E4 52 (28.3%) 28 (26.2%) 0.7299 0.0005 22 (30.6%) 215 (44.2%) 2 (1.1%) 6 (5.6%) 0.9407 0.0017 1 (1.4%) 75 (15.4%) 2 E4 3.4 (1.5) 2.5 (1.5) Clinical f/u, Years, Mean (SD) <.0001 0.0012 5.8 (3.2) 3.5 (2.5)
Variables Available for Comparison Common Cognitive Assessments Reprocessed Biomarker DIAN ADNI CSF reprocessed by ADNI Biomarker Core (Roche Elecsys) Logical Memory Immediate Animal Fluency A 1-42 Yes Yes Logical Memory Delayed Boston Naming A 1-40 Yes Yes Digit Span Forward Trailmaking A Tau Yes Yes pTau181 Yes Yes Digit Span Backward Trailmaking B Imaging reprocessed by DIAN Imaging Core MRI Hippocampal volume Cortical thickness in precuneus Amyloid PET Cortical mean Centiloid units Letter Fluency - F WAIS Digit Symbol Yes Yes Vegetable Fluency MMSE AV45 PiB Global Composite (All tests) (initially PiB)
Cognitive Composite Score Unadjusted comparisons (adjusting for sex, education, race, and APOE4 did not notably change results)
Conclusions Differences between ADAD and LOAD LOAD may be modified by age, APOE4 effects, and other pathologies ADAD may be modified by individual mutation effects on A , other substrates The course of symptomatic ADAD appears to be more aggressive than LOAD However, both share a long asymptomatic period and have identical AD endophenotypes (supported by ADNI s independent analyses): At symptomatic onset (often marked by inflection points): Increasing amyloidosis (amyloid PET; CSF A 42) Increasing tauopathy (CSF t-tau, p-tau) Progressive hippocampal atrophy Progressive cognitive decline Cautious optimism that lessons from ADAD will translate to LOAD


 & “Sporadic”")


")