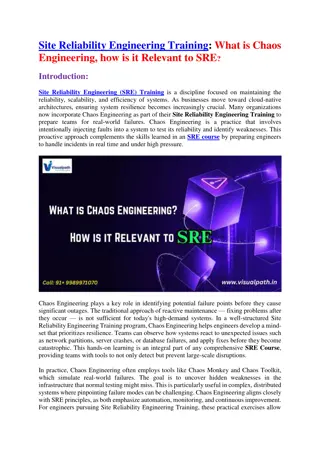
Best Site Reliability Engineering Training

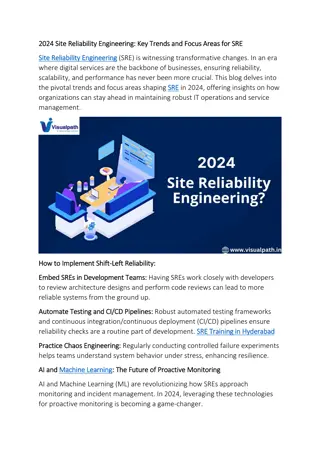
VisualPath offers the best Site Reliability Engineering Course to master SRE tools like Prometheus, Grafana, and Ansible. Get expert-led, job-oriented training with real-time projects, hands-on practice, and 24/7 access. Enjoy daily recorded classes

Uploaded on Apr 02, 2025 | 2 Views
Download Presentation

Please find below an Image/Link to download the presentation.
The content on the website is provided AS IS for your information and personal use only. It may not be sold, licensed, or shared on other websites without obtaining consent from the author.If you encounter any issues during the download, it is possible that the publisher has removed the file from their server.
You are allowed to download the files provided on this website for personal or commercial use, subject to the condition that they are used lawfully. All files are the property of their respective owners.
The content on the website is provided AS IS for your information and personal use only. It may not be sold, licensed, or shared on other websites without obtaining consent from the author.
E N D
Presentation Transcript
Click to edit Master title style FPPT.com
Introduction to SRE Metrics What are SRE Metrics? Why is monitoring crucial? Improves reliability, performance, and availability Helps in proactive issue resolution. +91-7032290546 www.visualpath.in
(SLOs) & (SLIs) SLO: The target reliability level (e.g., 99.9% uptime) SLI: Measurable values (e.g., request latency, error rate) +91-7032290546 www.visualpath.in
Key Metric #1 - Availability Ensures the service is accessible to users Formula: Availability = (Uptime / Total Time) 100 Tools: Prometheus, Grafana, Google Cloud Monitoring +91-7032290546 www.visualpath.in
Key Metric #2 - Latency Measures response time of a system Types: p50, p90, p99 latency Goal: Minimize response time for better user experience +91-7032290546 www.visualpath.in
Key Metric #3 - Error Rate Tracks failed requests vs. total requests High error rates indicate service instability Example:HTTP 500 errors, failed database queries +91-7032290546 www.visualpath.in
Key Metric #4 - Saturation Measures resource utilization (CPU, Memory, Disk) Helps prevent system overload and failures +91-7032290546 www.visualpath.in
Key Metric #5 - MTTR & MTBF MTTR (Mean Time to Recovery): Time to restore service after failure MTBF (Mean Time Between Failures): Duration between incidents +91-7032290546 www.visualpath.in
Conclusion & Best Practices Regularly review metrics and set alerts Automate monitoring and incident response Focus on user experience and reliability +91-7032290546 www.visualpath.in
For More Information About Site Reliability Engineering Address:- Flat no: 205, 2nd Floor, Nilagiri Block, Aditya Enclave, Ameerpet, Hyderabad-16 Ph. No: +91-998997107 Visit: www.visualpath.in E-Mail: online@visualpath.in +91-7032290546 www.visualpath.in
Thank You Thank You Visit: www.visualpath.in +91-7032290546 www.visualpath.in


 & (SLIs)")