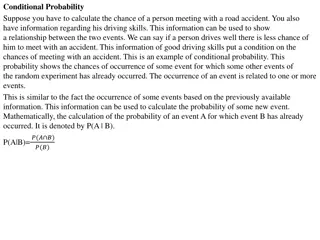
Bayes Classifier for Classification Modeling

 undefined
B4: Naïve Bayes classifier
Xin Liu, Konstantinos Pelechrinis
Naïve Bayes
Classifier
Outline
The key idea of Bayes
From event frequency to probability
Probability and classification
The key idea of Bayes
The key idea of Bayes
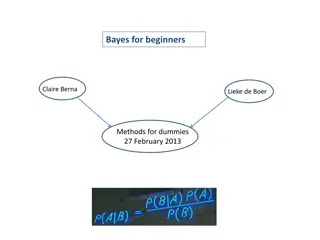
Formula based on Bayes’ Theorem
It tells us: How often event A happens
given that
event B happens
It can be used to
classify
which kind of event A will happen
(Eq. 1)
The key idea of Bayes
We need to calculate each element at the right side of Eq. (1), which are:
P(B|A)
P(A)
P(B)
We may convert Eq. (1) to equivalent expressions to facilitate our
understanding, calculation and classification.
Extra terminology for Bayes
Also called
Also called
From event frequency to probability
From event frequency to probability
Use a simple dataset as an example
Calculate frequency of events happening in the dataset
Convert frequency to probability
A simple Dataset
Our task is to use this training dataset to build a classification model, which then
classifies whether the car is stolen,
given
the following features:
Color
Type
Origin
Frequency & probability for each feature
In order to use Eq. (1) to do classification, we need to firstly calculate the
frequencies for events happening.
We need to calculate frequencies for
each feature separately
.
In this process, we will also convert frequencies to probabilities
From event frequency to probability
- feature: color
We have
a total
of 3
“Yes”
We have
a total
of 2
“No”
3+2=5
Becomes
denominator
Likelihood table is what we need to
input Bayesian equation
2+3=5
Becomes
denominator
Likelihood table is what we need to
input Bayesian equation
This value is the calculated result of P(Red|Yes),
which will be used in a later slide.
From event frequency to probability
- feature: type
3+2=5
Becomes
denominator
Likelihood table is what we need to
input Bayesian equation
2+3=5
Becomes
denominator
Likelihood table is what we need to
input Bayesian equation
This value is the calculated result of P(SUV|Yes),
which will be used in a later slide.
From event frequency to probability
- feature: origin
3+2=5
Becomes
denominator
Likelihood table is what we need to
input Bayesian equation
2+3=5
Becomes
denominator
Likelihood table is what we need to
input Bayesian equation
This value is the calculated result of P(Domestic|Yes),
which will be used in a later slide.
Probability and classification
The rationale of Bayes
A more detailed understanding
Connect Bayes to our dataset
-
Event B has happened, which contains specific values for
all features: color, type, origin
-
We use event B to judge whether event A means car stolen
or not.
-
P(A|B) is also expressed as: P(A|color=?, type=?, origin=?)
-
We will see how to use P(A|B) in the next slide
In our dataset,
it means:
Classification task
Per the training dataset, we obtain the likelihood (probability) tables.
We will use the tables to accomplish the classification task for the following
test record.
That is, we need to answer: for a car with “Red” color, “SUV” type and
“Domestic” origin, is the car stolen?
Classification task
The task is equivalent to
P(stolen = Yes|color = “Red”, type = “SUV”, origin = “Domestic”)
P(stolen = No|color = “Red”, type = “SUV”, origin = “Domestic”)
V.S.
Which probability value is larger?
Probability of “Yes” or “No”
Let’s use P(Yes|B) to denote P(stolen = Yes|color = “Red”, type = “SUV”, origin = “Domestic”)
P(Yes|B) = P(Red|Yes) * P(SUV|Yes) * P(Domestic|Yes) * P(Yes) / P(B)
= 3/5 * 1/5 * 2/5 * 1 / P(B)
= 0.048 / P(B)
P(No|B) = P(Red|No) * P(SUV|No) * P(Domestic|No) * P(No) / P(B)
= 3/5 * 1/5 * 2/5 * 1 / P(B)
= 0.144 / P(B)
Calculated in Section “From event frequency to probability”
Let’s use P(No|B) to denote P(stolen = No|color = “Red”, type = “SUV”, origin = “Domestic”)
This equation assumes:
stolen=Yes
.
So probability for
stolen=Yes
is 1.
Probability of “Yes” or “No”
P(Yes|B) = 0.048 / P(B)
P(No|B) = 0.144 / P(B)
P(Yes|B) < P(No|B)
Classification result: this car (test record) is not stolen
Not necessary to calculate P(B)
since it doesn’t influence
this comparison
References
https://www.kdnuggets.com/2020/06/naive-bayes-algorithm-everything.html
https://towardsdatascience.com/naive-bayes-classifier-81d512f50a7c
https://www.geeksforgeeks.org/naive-bayes-classifiers/
Delve into the key idea of the Bayes Classifier by exploring its formulation based on Bayes Theorem. Learn how to calculate probabilities and frequencies to build a classification model using a simple dataset with features like Color, Type, and Origin. Uncover the process of converting frequencies to probabilities for effective classification.

Download Presentation

Please find below an Image/Link to download the presentation.
The content on the website is provided AS IS for your information and personal use only. It may not be sold, licensed, or shared on other websites without obtaining consent from the author.If you encounter any issues during the download, it is possible that the publisher has removed the file from their server.
You are allowed to download the files provided on this website for personal or commercial use, subject to the condition that they are used lawfully. All files are the property of their respective owners.
The content on the website is provided AS IS for your information and personal use only. It may not be sold, licensed, or shared on other websites without obtaining consent from the author.
E N D
Presentation Transcript
B4: Nave Bayes classifier Xin Liu, Konstantinos Pelechrinis
Outline The key idea of Bayes From event frequency to probability Probability and classification
The key idea of Bayes Formula based on Bayes Theorem (Eq. 1) It tells us: How often event A happens given that event B happens It can be used to classify which kind of event A will happen
The key idea of Bayes We need to calculate each element at the right side of Eq. (1), which are: P(B|A) P(A) P(B) We may convert Eq. (1) to equivalent expressions to facilitate our understanding, calculation and classification.
Extra terminology for Bayes Also called Also called
From event frequency to probability Use a simple dataset as an example Calculate frequency of events happening in the dataset Convert frequency to probability
A simple Dataset Our task is to use this training dataset to build a classification model, which then classifies whether the car is stolen, given the following features: Color Type Origin
Frequency & probability for each feature In order to use Eq. (1) to do classification, we need to firstly calculate the frequencies for events happening. We need to calculate frequencies for each feature separately. In this process, we will also convert frequencies to probabilities
From event frequency to probability - feature: color
We have a total of 3 Yes
We have a total of 2 No
Likelihood table is what we need to input Bayesian equation Becomes denominator 3+2=5
Likelihood table is what we need to input Bayesian equation 2+3=5 Becomes denominator
This value is the calculated result of P(Red|Yes), which will be used in a later slide.
From event frequency to probability - feature: type
Likelihood table is what we need to input Bayesian equation Becomes denominator 3+2=5
Likelihood table is what we need to input Bayesian equation 2+3=5 Becomes denominator
This value is the calculated result of P(SUV|Yes), which will be used in a later slide.
From event frequency to probability - feature: origin
Likelihood table is what we need to input Bayesian equation Becomes denominator 3+2=5
Likelihood table is what we need to input Bayesian equation 2+3=5 Becomes denominator
This value is the calculated result of P(Domestic|Yes), which will be used in a later slide.
The rationale of Bayes A more detailed understanding
Connect Bayes to our dataset In our dataset, it means: - Event B has happened, which contains specific values for all features: color, type, origin - We use event B to judge whether event A means car stolen or not. - P(A|B) is also expressed as: P(A|color=?, type=?, origin=?) - We will see how to use P(A|B) in the next slide
Classification task Per the training dataset, we obtain the likelihood (probability) tables. We will use the tables to accomplish the classification task for the following test record. That is, we need to answer: for a car with Red color, SUV type and Domestic origin, is the car stolen?
Classification task The task is equivalent to P(stolen = Yes|color = Red , type = SUV , origin = Domestic ) V.S. P(stolen = No|color = Red , type = SUV , origin = Domestic ) Which probability value is larger?
Probability of Yes or No Let s use P(Yes|B) to denote P(stolen = Yes|color = Red , type = SUV , origin = Domestic ) Calculated in Section From event frequency to probability P(Yes|B) = P(Red|Yes) * P(SUV|Yes) * P(Domestic|Yes) * P(Yes) / P(B) = 3/5 * 1/5 * 2/5 * 1 / P(B) = 0.048 / P(B) This equation assumes: stolen=Yes. So probability for stolen=Yes is 1. Let s use P(No|B) to denote P(stolen = No|color = Red , type = SUV , origin = Domestic ) P(No|B) = P(Red|No) * P(SUV|No) * P(Domestic|No) * P(No) / P(B) = 3/5 * 1/5 * 2/5 * 1 / P(B) = 0.144 / P(B)
Probability of Yes or No P(Yes|B) = 0.048 / P(B) P(No|B) = 0.144 / P(B) P(Yes|B) < P(No|B) Classification result: this car (test record) is not stolen Not necessary to calculate P(B) since it doesn t influence this comparison
References https://www.kdnuggets.com/2020/06/naive-bayes-algorithm-everything.html https://towardsdatascience.com/naive-bayes-classifier-81d512f50a7c https://www.geeksforgeeks.org/naive-bayes-classifiers/


,")


,")


,")