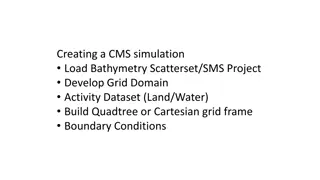
Atmospheric Modeling Task with Initial Conditions and Grid Setup
Create a model grid with 2D arrays for prognostic variables, set initial dry and adiabatic environmental conditions, introduce thermal and pressure perturbations, and visualize using GrADS. Define variables like velocities, perturbation temperature, and pressure fields, along with base state variables. Initialize with calm, shearless conditions for a realistic simulation.

Download Presentation

Please find below an Image/Link to download the presentation.
The content on the website is provided AS IS for your information and personal use only. It may not be sold, licensed, or shared on other websites without obtaining consent from the author.If you encounter any issues during the download, it is possible that the publisher has removed the file from their server.
You are allowed to download the files provided on this website for personal or commercial use, subject to the condition that they are used lawfully. All files are the property of their respective owners.
The content on the website is provided AS IS for your information and personal use only. It may not be sold, licensed, or shared on other websites without obtaining consent from the author.
E N D
Presentation Transcript
Model Task #3: Grid setup, initial condition and visualization ATM 562 Fall 2021 Fovell (see course notes, Chapter 11) Last modified 10/9/21 1
Outline Create the model grid and 2D arrays that will hold model prognostic variables Make initial environment dry, calm, adiabatic Introduce a thermal perturbation Create an initial pressure perturbation field responding to the initial Visualization (GrADS example provided) 2
Model grid To facilitate coding, we will employ a frame of fake points completely surrounding our physical domain This is illustrated for 1-based (Fortran) and 0-based (C++, Python) languages on the following two slides Note for horizontal direction (Fortran notation): First real U(i,k) point is for location i=2 U(1,k) does exist but will never be referenced There is no U value at right edge of plot frame (no nx+1) Note for vertical direction (Fortran notation): First real W(i,k) point is for level k=2 W(i,1) does exist but will never be referenced There is no W at the top edge of plot frame (no nz+1) 3
Model variables - I We will have four prognostic variables: u = zonal horizontal velocity w = vertical velocity th = perturbation potential temperature pi = perturbation nondimensional pressure Note that uis a full field , including a base state that could vary with height, but th and pi are the perturbation fields only. Each prognostic variable requires three 2D arrays, dimensioned nx by nz The leapfrog scheme uses 3 time levels, n+1, n, and n-1 I will use this naming convention: thp, th, thm The scheme can be coded more efficiently than I describe, but the code will not be as easily readable I will add a fifth prognostic variable v, for meridional velocity. My example GrADS code requires this, and we will use vp, v, vm in MT4. 6
Model variables - II We will also have, at a minimum, five 1D vectors to hold base state variables tb = mean potential temperature pib = mean nondimensional pressure rhou = mean density at u levels rhow = mean density at w levels ub = mean zonal velocity Initialize with zeroes: calm, shearless I also like to carry pb, for mean dimensional pressure You can also add a base state virtual temperature, thvb, if you intend to incorporate moisture 7
Example Fortran code ! parameters parameter(nx=83,nz=42) ! grid box lengths parameter(dx=400.,dz=400.) ! base state vectors dimension tb(nz),qb(nz),pb(nz),pib(nz),rhou(nz),rhow(nz),ub(nz) ! 2D prognostic arrays - 3 time levels dimension thp(nx,nz),th(nx,nz),thm(nx,nz) ! pot. temp. pert. dimension wp(nx,nz),w(nx,nz),wm(nx,nz) ! vert. vel. dimension up(nx,nz),u(nx,nz),um(nx,nz) ! zonal horiz. vel. dimension vp(nx,nz),v(nx,nz),vm(nx,nz) ! merid. horiz. vel. dimension pip(nx,nz),pi(nx,nz),pim(nx,nz) ! ndim pert. pres. ! real numbers You can also add a base state virtual temperature, thvb, if you intend to incorporate moisture 8
Modified base state Revise your MT1/MT2 tb and qb to create a calm, dry, neutral base state. (Don t throw your MT2 code away.) tb = 300. qb = 0. ub = 0. Enforce zero-gradient boundary conditions on tb, qb and ub. E.g., ensure that tb(1) = tb(2) and tb(nz) = tb(nz-1) [Fortran indexing example] Your MT1/MT2 code will compute the appropriate mean nondimensional pressures and densities, given new sounding. NB: your first real rhow should be computed with psurf. Do this after WK sounding but before calc of pib, rhou 9
Initial thermal perturbation where zT = height of theta level above model surface = (k 1.5) z for Fortran, (k-0.5) z for Python IMID = center of domain = (nx+1)/2 for Fortran, (nx-1)/2 for Python, if nx is odd RADX and RADZ are horizontal and vertical thermal radii ZCNT = height of thermal center above model surface = amplitude = 3 K [etc., see Chap. 11] In the above, is trigonometric , not nondimensional pressure. tripgi = 4.0*atan(1.0) 10
Coding I ll put the thermal perturbation in a double DO loop over all real k and i imid=(nx+1)/2 do k=2,nz-1 do i=2,nx-1 argz=((dz*(float(k)-1.5)-zcnt)/radz)**2 argx=(dx*(i-imid)/radx)**2 rad=sqrt(argz+argx) if(rad.le.1.)then th(i,k)=0.5*delt*(cos(trigpi*rad)+1) else th(i,k)=0. endif thm(i,k)=th(i,k) ! Initialize thm too enddo enddo ! Then enforce boundary conditions on th, thm 11
Column-major vs. row-major order In Fortran, memory access is more efficient if arrays are handled (in DO loops) win column- major order. For an array th(nx,nz), that means nesting the loop over NXinside the loop over NZ. (This was done in code on previous slide.) In contrast, row-major order is used in C++ and Python, so it is theoretically more efficient put the loop over NZin the inner loop. Does this make a difference in practice? Maybe code your final project both ways and compare. 12
Theory vs. practice in Fortran Since Fortran is column-major, theoretically the leftmost index should vary fastest for greatest efficiency do k = 2, nz-1 do i = 2, nx-1 th(i,k) = enddo enddo However, in practice, nz < nx, so it still may be more efficient to put make k the inner loop, if loops are short do i = 2, nx-1 do k = 2, nz-1 th(i,k) = enddo enddo An alternative is to dimension arrays (nz,nx) instead 13
Initial pressure perturbation Placing a temperature perturbation impulsively into the model will cause an immediate environmental reaction. In a neutral state as we are adopting here, gravity waves will not be excited, but sound waves will be. We can attempt to address this imbalance by also providing an initial pressure perturbation , hydrostatically balanced with . In theory, the atmosphere responds to this temperature perturbation very quickly, making its influence detectable over an enormous area, because sound waves are so fast. In practice, the magnitude of the environmental disturbance decreases rapidly away from the thermal. As a compromise, and an initial attempt, we will modify only grid points residing within and below the thermal. We ll see later if that actually does any good! 14
Perturbation hydrostatic equation (dry atmosphere) Seen from (3.34) with dw/dt = 0 We will assume that far above the thermal, the environment is undisturbed; i.e., = 0. Discretize the equation above and integrate downward, towards the model surface. Since and are defined at the same levels, vertical averaging of the temperatures is needed (see text). 15
Turn in a copy of this plot and your code Temp. pert. (shaded) Dimensional pres. pert. (contoured) 16
Initializing the leapfrog scheme The leapfrog scheme uses three time levels, so it actually requires two initial conditions for each prognostic variable, at times nand n-1. Typically, we don t have knowledge of the fields at time - t prior to the model start, so we fudge it by presuming the field is not changing with time (e.g., thm = th, and pim = pi). That is obviously false, and this can cause problems. It is one way the scheme s computational mode (see Chapter 5) can be excited. Note the code snippets I provided also initialized the time n-1 fields. 17
Visualization One option (especially for Fortran users) is GrADS Sample Fortran code for generating GrADS files is detailed in Chap. 11 and posted on the course website Links GrADS home page Users guide and scripting basics GrADS control file Controlling colors GrADS script library 18
Programming concept (including information applicable to subsequent model tasks) grads_example_code_augmented.f grads_routines_augmented.f (see notes and website) 19
program task3 ! parameters parameter(nx=83,nz=42) ! grid box lengths parameter(dx=400.,dz=400.) ! base state vectors dimension tb(nz),qb(nz),pb(nz),pib(nz),rhou(nz),rhow(nz),ub(nz) ! 2D prognostic arrays - 3 time levels dimension thp(nx,nz),th(nx,nz),thm(nx,nz) ! pot. temp. pert. dimension wp(nx,nz),w(nx,nz),wm(nx,nz) ! vert. vel. dimension up(nx,nz),u(nx,nz),um(nx,nz) ! zonal horiz. vel. dimension vp(nx,nz),v(nx,nz),vm(nx,nz) ! merid. horiz. vel. dimension pip(nx,nz),pi(nx,nz),pim(nx,nz) ! ndim pert. pres. [more ] ! ---------------------------------------------------------------- ! model setup code specify dt, define d2x = dx + dx, initialize d2t = dt sounding: tb, qb, ub derived quantities: pib, rhou, rhow do boundary conditions on base state arrays ! then do your initial conditions, apply boundary conditions on them [ ] 20
! define plot interval nplt=60 ! plot every 60 time steps, or 300 sec ! ---------------------------------------------------------------- ! GrADS initialization is here ! ---------------------------------------------------------------- ! * set your casename (will create 'casename'.ctl, 'casename'.dat) ! * create a temporary control (*.ctl) file ! * write initial condition to data (*.dat) file ! examples... you need to change these casename='test' ! declare 'character*80 casename' above iplt = 0 ! counter for plotting calls byteswap = 0 ! if byteswapping not needed, set = 0 igradscnt =999 ! grads counter - dummy value to start call write_to_grads_ctl(casename,nx,nz,dt,dx,dz, & igradscnt,nplt,byteswap) ! create the temporary control file igradscnt =0 ! reset grads counter call dumpgrads(igradscnt,u,v,w,th,pi,rhou,tb,pib,ub,qb,nx,nz,cpd) 21
! ---------------------------------------------------------------- ! model integration loop STARTS here (added in MT4) ! ---------------------------------------------------------------- ! * update plot counters ! * integrate your equations, take care of boundary conditions ! * set for next time step ! example... iplt = iplt + 1 ! plot counter ! ---------------------------------------------------------------- ! decide if it's time to plot... ! ---------------------------------------------------------------- ! * if it's time to plot, call dumpgrads and reset plot counter ! example... if(iplt.eq.nplt)then call dumpgrads(igradscnt,u,v,w,th,pi,rhou,tb,pib,ub,qb,nx,nz,cpd) iplt=0 endif ! ---------------------------------------------------------------- ! At the end of the model integration (needed for MT3) ! ---------------------------------------------------------------- print *,' writing final control file call write_to_grads_ctl(casename,nx,nz,dt,dx,dz, 1 igradscnt,nplt,byteswap) ! final ctl file 22
The GrADS strategy summary GrADS data sets consist of two individual files: a control (.ctl) file and a binary data (.dat) file After creating the base state and initial condition and their boundary conditions: Define casename(name for .ctl and .dat files) Call write_to_grads_ctlto create a new, but temporary, .ctl file Call dumpgradsto write out the initial condition During your model integration Call dumpgradswhen it s time to write history data After the integration ends Call write_to_grads_ctlto create the final, complete .ctl file 23
DSET ^test.dat OPTIONS sequential UNDEF -9.99E33 XDEF 81 LINEAR -16.00000 0.40000 YDEF 1 LINEAR 1.0 1.0 ZDEF 40 levels 0.200 0.600 [ ] 15.800 TDEF 999 LINEAR 00:00Z01JAN2000 1mn VARS 11 u 40 00 horizontal velocity upr 40 00 pert horizontal velocity v 40 00 north-south velocity w 40 00 vertical velocity th 40 00 potential temperature thpr 40 00 pert potential temperature qv 40 00 vapor mixing ratio qvpr 40 00 pert vapor mixing ratio pi 40 00 ndim pressure pipr 40 00 pert ndim pressure pprmb 40 00 pert pressure in millibars ENDVARS GrADS control file test.ctl 24
GrADS scripts Some scripts available on class web page 25
* plot_init_cond.gs [Copy on class web page] * define some nice colors via the rgbset script. Also available on class web page 'run rgbset.gs' * set background color white and clear screen 'set display color white' 'clear' * set map projection off 'set mproj off' * this formats the virtual page 'set vpage 0 8.5 0.5 8.5' * smooth contours. enabled until switched off. 'set csmooth on' * ----------- make temperature perturbation plot ----------------- * set contour label, make thp plot, draw title and axes * declare a color-shaded plot 'set gxout shaded' * define colors and contour levels * colors are as defined in rgbset.gs 'set clevs -3 -2.5 -2 -1.5 -1 -0.5 0 0.5 1.0 1.5 2.0 2.5 3' 'set ccols 49 47 45 44 43 42 0 0 62 63 64 65 67 69 * this next line turns off the grads logo 'set grads off 26
* override default GrADS axis labels (GrADS doesnt stop you from making mistakes) 'set xaxis -16 16 4' 'd thpr' * draw the colorbar. requires script cbarn.gs 'run cbarn 1 0 5 0.18' * reset graphics output to contour 'set gxout contour' * ----------- make pressure perturbation plot ----------------- * set contour color and contour interval 'set ccolor 1' 'set cint 50' * suppress contour labels 'set clab off' * this next line tries to suppress the zero contour 'set black 0 0' * plot pprmb but convert to Pascals 'd pprmb*100' * draw titles and labels 'draw title initial temp & pres perturbations (K, Pa)' 'draw xlab x (km)' 'draw ylab z (km) * ----------- make a PNG plot --------------------------------- gxprint init_tp_pp.png 27