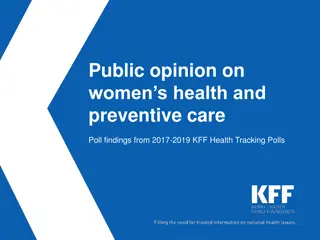
Analyzing Public Opinion Polls


MEASURING PUBLIC
OPINION

INTRODUCTION
One of the most common news reports during a presidential
campaign: who’s ahead in the polls?
Development of scientific public opinion polling dates back to 1936
Useful tools for tracking public opinion, but they can be abused
WHAT CONSTITUTES A VALID POLL?
Unbiased questions
questions should not hint at a preferred answer
Representative sample
Example: you only need a tiny sample to determine if the soup you’re cooking has
enough salt.
Random sample is best but not always possible
Polls of candidate preferences need to target “likely voters” not “registered
voters” or adults. How can this skew the results?
What else might make it hard to sample all voters?
Often pollsters “weight” their sample to reflect overall makeup of country
according to the US Census (age, gender, race, etc).
Information to Look for in a Public
Opinion Poll: Direction of Results
Such as breakdown of for and against an issue
Why, then, is gun control not passed
?
But Direction Isn’t
Everything
Gun rights supporters have
stronger feelings about issue
INTENSITY
How strongly respondents feel about an issue or candidate,
measured on a scale of 1-10, or “a lot, somewhat, not at all,” or a
feeling thermometer.
Salience
How important is the issue?
Most Americans support stronger environmental protection; why
isn’t more done?
Environment Way
Down the List of
Most Important
Problems
Polls Over Time
Single poll
snapshot in time
only really valid for that date
Tracking polls
conducted weekly
Some have datasets going back 60 years
Cohort design
polling same group of individuals to see individual
changes
LIMITATIONS OF POLLS
Margin of error—called sampling error.
Should be under 4%
If poll with MOE of 3% said Clinton led Trump
by 5%, that is not entirely accurate. Why?
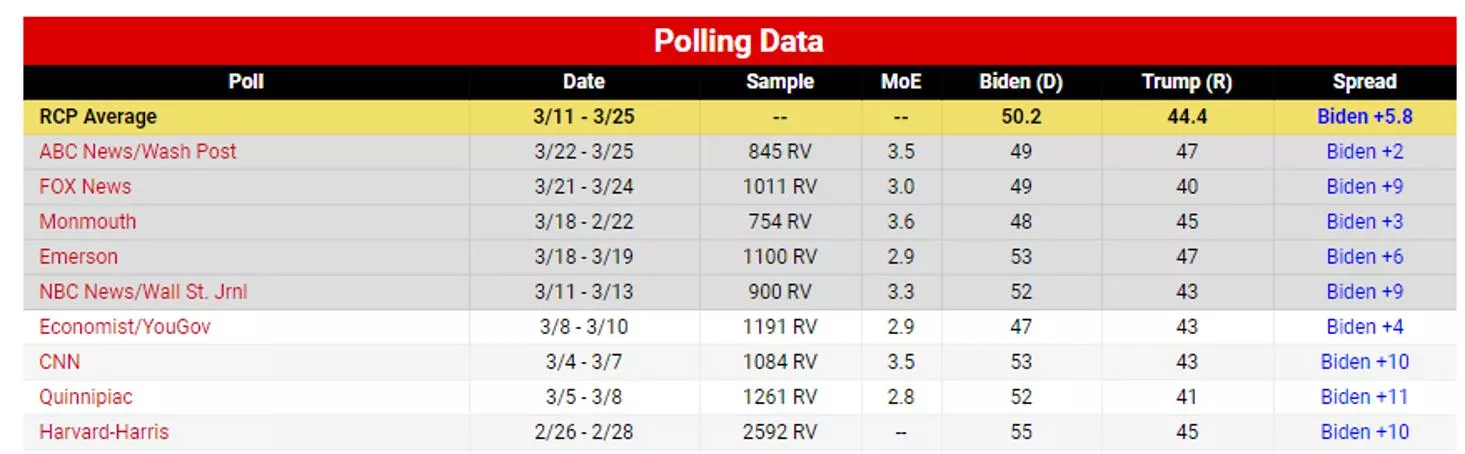
Different polls show different results
Avoid polls released by campaigns;
Independent polls such as Gallup and Harris
are most objective
Consider looking at an average of all polls
(Nate Silver)
Limitations--Continued
Response bias--respondents aren’t always
completely honest
Nonresponse bias and selection bias--
some respondents refuse to answer
questions
Response rate is only about 10%
Caller ID effect
Public opinion polls generally don’t
measure intensity or salience
Gun control for example
Question
Most polls during the 2016 presidential election predicted Hillary
Clinton would win, so what happened?
Watch video in news article:
https://www.thewrap.com/every-poll-
that-got-election-wrong-donald-trump/
Answers
It was within the margin of error.
Media biases due to staying in their own bubbles talking only to
people who agreed with them.
Nonresponse bias. “Secret” Trump voters who kept a low profile, did
not respond to surveys.
Hillary Clinton DID win the popular vote as predicted!
NY Times said she had the same chance of losing as a kicker from 10
yard line has of missing a field goal.
See Seahawks vs. Cardinals October 24, 2016 game—a bad omen
https://www.azcardinals.com/video/highlights-cardinals-and-
seahawks-miss-fgs-in-ot-17947138
In other words, it was a fluke
Explore the evolution and significance of public opinion polling, focusing on the methodology of valid polls, key information to look for, understanding intensity and salience of opinions, and the limitations of polls. Gain insights into how polls are conducted over time and why direction isn't the only factor in gauging public sentiment.

Download Presentation

Please find below an Image/Link to download the presentation.
The content on the website is provided AS IS for your information and personal use only. It may not be sold, licensed, or shared on other websites without obtaining consent from the author.If you encounter any issues during the download, it is possible that the publisher has removed the file from their server.
You are allowed to download the files provided on this website for personal or commercial use, subject to the condition that they are used lawfully. All files are the property of their respective owners.
The content on the website is provided AS IS for your information and personal use only. It may not be sold, licensed, or shared on other websites without obtaining consent from the author.
E N D
Presentation Transcript
MEASURING PUBLIC OPINION
INTRODUCTION One of the most common news reports during a presidential campaign: who s ahead in the polls? Development of scientific public opinion polling dates back to 1936 Useful tools for tracking public opinion, but they can be abused
WHAT CONSTITUTES A VALID POLL? Unbiased questions questions should not hint at a preferred answer Representative sample Example: you only need a tiny sample to determine if the soup you re cooking has enough salt. Random sample is best but not always possible Polls of candidate preferences need to target likely voters not registered voters or adults. How can this skew the results? What else might make it hard to sample all voters? Often pollsters weight their sample to reflect overall makeup of country according to the US Census (age, gender, race, etc).
Information to Look for in a Public Opinion Poll: Direction of Results Such as breakdown of for and against an issue Why, then, is gun control not passed?
But Direction Isnt Everything Gun rights supporters have stronger feelings about issue
INTENSITY How strongly respondents feel about an issue or candidate, measured on a scale of 1-10, or a lot, somewhat, not at all, or a feeling thermometer.
Salience How important is the issue? Most Americans support stronger environmental protection; why isn t more done?
Environment Way Down the List of Most Important Problems
Polls Over Time Single poll snapshot in time only really valid for that date Tracking polls conducted weekly Some have datasets going back 60 years Cohort design polling same group of individuals to see individual changes
LIMITATIONS OF POLLS Margin of error called sampling error. Should be under 4% If poll with MOE of 3% said Clinton led Trump by 5%, that is not entirely accurate. Why? Different polls show different results Avoid polls released by campaigns; Independent polls such as Gallup and Harris are most objective Consider looking at an average of all polls (Nate Silver)
Limitations--Continued Response bias--respondents aren t always completely honest Nonresponse bias and selection bias-- some respondents refuse to answer questions Response rate is only about 10% Caller ID effect Public opinion polls generally don t measure intensity or salience Gun control for example
Question Most polls during the 2016 presidential election predicted Hillary Clinton would win, so what happened? Watch video in news article: https://www.thewrap.com/every-poll- that-got-election-wrong-donald-trump/
Answers It was within the margin of error. Media biases due to staying in their own bubbles talking only to people who agreed with them. Nonresponse bias. Secret Trump voters who kept a low profile, did not respond to surveys. Hillary Clinton DID win the popular vote as predicted! NY Times said she had the same chance of losing as a kicker from 10 yard line has of missing a field goal. See Seahawks vs. Cardinals October 24, 2016 game a bad omen https://www.azcardinals.com/video/highlights-cardinals-and- seahawks-miss-fgs-in-ot-17947138 In other words, it was a fluke