Analyzing Election Coverage Patterns
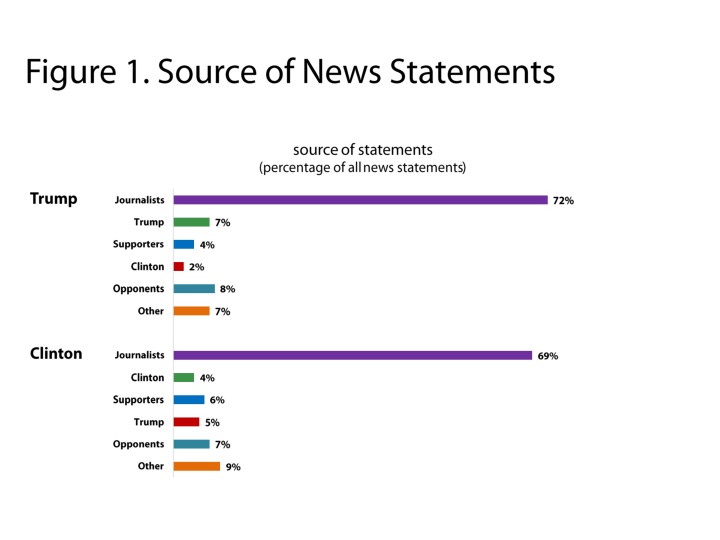
The data presents percentages based on positive and negative statements about Trump's coverage. It excludes neutral statements and offers insights into the distribution of media attention over four weeks of the election. Additionally, it highlights the minimal coverage received by Kaine during the first week.

Download Presentation

Please find below an Image/Link to download the presentation.
The content on the website is provided AS IS for your information and personal use only. It may not be sold, licensed, or shared on other websites without obtaining consent from the author.If you encounter any issues during the download, it is possible that the publisher has removed the file from their server.
You are allowed to download the files provided on this website for personal or commercial use, subject to the condition that they are used lawfully. All files are the property of their respective owners.
The content on the website is provided AS IS for your information and personal use only. It may not be sold, licensed, or shared on other websites without obtaining consent from the author.
E N D
Presentation Transcript
Note: Percentages are based on positive and negative statements only. Neutral statements, which accounted for 38 percent of Trumps coverage, are not included.
Note: Percentages based on negative and positive statements only. Neutral statements are excluded.
Week 1 Week 2 Week 3 Week 4 Note: Kaine received less than half of 1 percent of election coverage during Week 1.