Analysis of Undergraduate Employment Trends and Salaries in 2020
In 2020, undergraduates saw a range of employment outcomes with varying salaries across different fields. The data reveals statistics on employment rates, average salaries, top employers, and regional employment patterns. Major industries like Accounting, Finance, HR/Management, Marketing, and Supply Chain are analyzed, providing insights into the job market for recent graduates.
Download Presentation

Please find below an Image/Link to download the presentation.
The content on the website is provided AS IS for your information and personal use only. It may not be sold, licensed, or shared on other websites without obtaining consent from the author.If you encounter any issues during the download, it is possible that the publisher has removed the file from their server.
You are allowed to download the files provided on this website for personal or commercial use, subject to the condition that they are used lawfully. All files are the property of their respective owners.
The content on the website is provided AS IS for your information and personal use only. It may not be sold, licensed, or shared on other websites without obtaining consent from the author.
E N D
Presentation Transcript
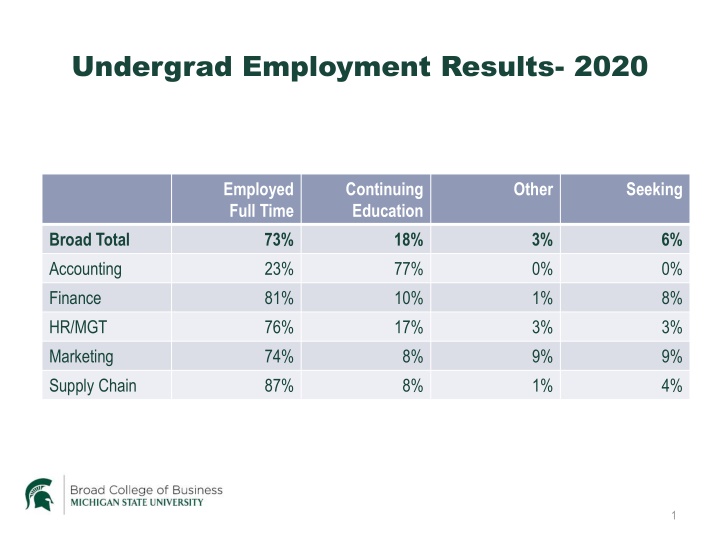
Undergrad Employment Results- 2020 Employed Full Time Continuing Education Other Seeking Broad Total Accounting Finance HR/MGT Marketing Supply Chain 73% 23% 81% 76% 74% 87% 18% 77% 10% 17% 8% 8% 3% 0% 1% 3% 9% 1% 6% 0% 8% 3% 9% 4% 1
Undergrad Salaries- 2020 Average 62,685$ $65,182 $70,383 $56,300 $51,391 $65,879 Low High Broad Total Accounting Finance HR Management Marketing Supply Chain $23,920 $52,000 $45,000 $52,500 $23,920 $40,000 $160,000 $85,000 $160,000 $60,000 $79,900 $105,000 2
Top Employers- 2020 General Motors Quicken Loans Ford Motor Company Deloitte Jackson National Life PepsiCo Target Ally Financial EY Amazon 3
Employment by US Region Region Midwest Northeast Southwest South Mid-Atlantic No. California West (excluding Cal) So. California % Students Employed 77% 7% 5% 4% 2% 2% 2% 1% Avg. Salary $59,296 $65,050 $55,750 $49,860 $60,167 $88,750 $72,500 $85,000 4
