AMPS WINTER YOPP-SH FORECAST DATA IMPACT STUDY
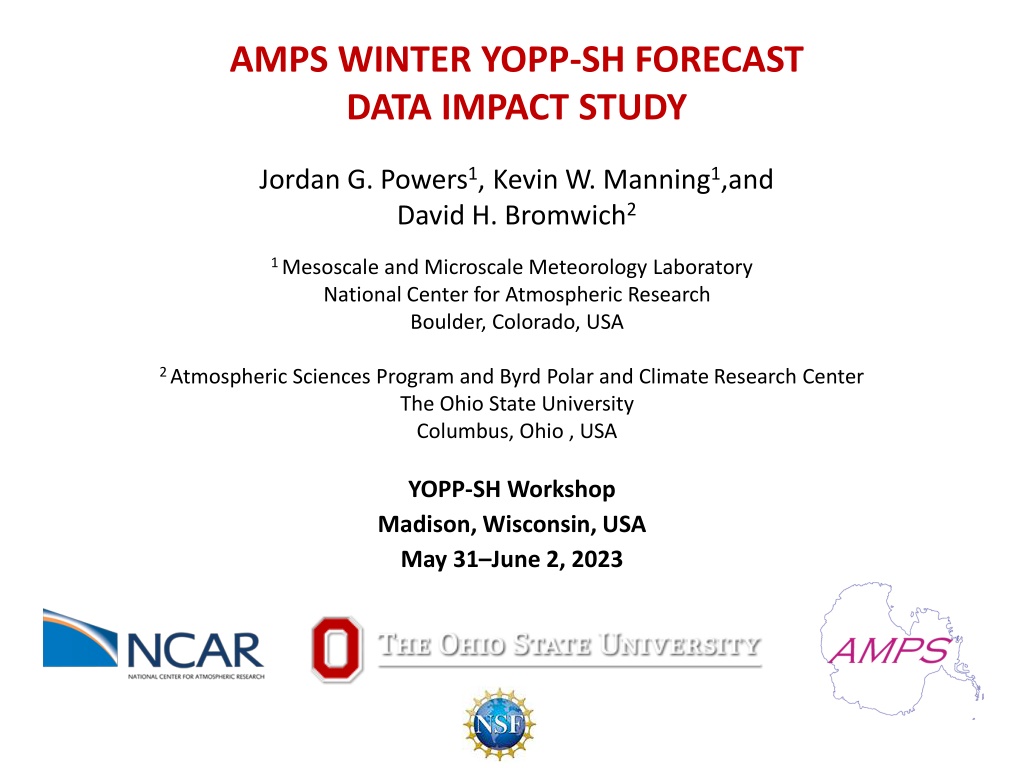
AMPS WINTER YOPP-SH FORECAST
DATA IMPACT STUDY
Jordan G. Powers
1
, Kevin W. Manning
1
,and
David H. Bromwich
2
1
Mesoscale and Microscale Meteorology Laboratory
National Center for Atmospheric Research
Boulder, Colorado, USA
2
Atmospheric Sciences Program and Byrd Polar and Climate Research Center
The Ohio State University
Columbus, Ohio , USA
YOPP-SH Workshop
Madison, Wisconsin, USA
May 31
–
June 2, 2023
BACKGROUND
• WMO Polar Prediction Project (PPP)
(2013–2022)
– Goal: Research to improve environmental
prediction for the polar regions
– YOPP-SH:
Y
ear
o
f
P
olar
P
rediction—
S
outhern
H
emisphere
•
Program of the PPP: Observation and prediction in the
high southern latitudes
– YOPP-SH Winter Campaign:
April
–
August 2022
• Approach:
T
argeted
O
bserving
P
eriods (
TOP
s
) (1–2
weeks)
with enhanced atmospheric observing
• Cf: YOPP-SH Summer (Nov 2018
– Feb
2019) campaign with
continuous observation activities
BACKGROUND
• YOPP-SH Winter Campaign Data
(i) Extra radiosonde launches from Antarctic/sub-Antarctic stations
(ii) Enhanced observation systems at selected stations
(e.g., Micro Rain Radar, Anasphere sonde instruments
)
• Current Ohio State/NCAR Study: Use YOPP Winter Datasets to
Improve WRF and AMPS Forecasts for Antarctica
– Methodology: Model forecast experiments and case simulations
– Tools:
W
eather
R
esearch and
F
orecasting (WRF) Model
WRF data assimilation (DA) systems
YOPP-SH winter sounding and special surface data
OSU/NCAR STUDY AREAS
1) Investigate Effects
of
Enhanced-Sounding Dataset on AMPS
Winter Forecasts (Data Impact Study)
– Analyze forecast impacts of augmented SH sounding program
–
Assess potential of
new DA
approach
for use in AMPS
2) Examine WRF Polar Cloud Simulations (Ohio State)
– Apply YOPP-SH special observations for evaluation of
WRF cloud simulations by microphysics schemes:
Davis, Vernadsky
– Special measurements: Microwave radar;
ceilometer cloud phase; cloud constituent data
–
Aim: Improve microphysics for WRF polar applications
DATA IMPACT STUDY
• Approach: Data Assimilation Experiments
(1) Test enhanced TOP sonde dataset
(2) Test new data assimilation (DA) method for AMPS
–
M
ulti-
R
esolution
I
ncremental
4DVAR
(MRI-4DVAR)
• Tool: Modified AMPS
WRF configuration
– 24-km Southern Ocean grid: Expanded from
AMPS 24-km grid to capture more of
Australia
– 8-km Antarctic grid: Same as AMPS WRF
DATASET EXPERIMENTS
•
Experiment 1— STD:
AMPS WRF Standard Observations
– Surface AWS and station obs
– Radiosondes
– Ships and buoys
– Aircraft reports
– Satellite winds
– Satellite radiance measurements
– GPSRO (radio occultation) measurements
•
Experiment 2— TOP:
AMPS Standard Observations
+ TOP Extra
S
oundings
YOPP-SH TOP RADIOSONDE SITES
YOPP-SH TOP
Radiosonde Sites
Numbers: X (Y)
X= No. extra sondes/day
(Y)= No. regular
sondes/day
Approx. total for TOPS:
1200
Invercargill
2 (2)
2 extra (2 regular)
DATA
ASSIMILATION EXPERIMENTS: APPROACH 1— MRI-4DVAR
1) MRI-4DVAR:
M
ulti-
R
esolution
I
ncremental
4-D
Var
iational DA
– 4DVAR: Obs assimilated at their
actual times
within
a time window
• Cf. 3DVAR: Single-time attribution for all obs
• 6-hr assimilation window
– 4DVAR: Better analyses and forecasts than 3DVAR,
but much
more computationally expensive
–
Multi-Resolution Incremental
: Two-phased approach using
coarser
and
finer
horizontal grid spacings on the
assimilation domain in different steps to save cost
(i) Calculation of background–obs departures:
Regular grid spacing
used— 24 km
(ii) Generation of analysis increments (minimization):
Coarser grid spacing used
—
72 km
DATA ASSIMILATION EXPERIMENTS
: APPROACH 2— 3DEnVar
2) 3DEnVar:
3-D
imensional
En
semble-
Var
iational DA
– Used by WRF in AMPS
–
Ensemble
-Variational: Process uses
background error (BE)
information from a
(WRF)
forecast ensemble
–
2 BE sources in 3DEnVar: Static and Ensemble
(1) BEs derived from previous fcsts:
Static BEs
(2) BEs derived from current ensemble of fcsts:
Ensemble BEs
(“flow-dependent” errors)
WRF forecast
preparation path
Observations
(incl. TOP soundings)
FORECAST EXPERIMENTS
• WRF Forecasts for TOPs
– Initializations:
0000 and 1200 UTC for every TOP day
–
Length: 120 hrs
– 6-hr cycled forecasts with DA performed leading up to each
target forecast
• TOPs
Period
Region of Extra Sondes
1
9–16 May 2022
pan-Antarctic
2
2
–8 June
pan-Antarctic
3
1–9 July
East Antarctica–Ross Sea
4
14
–
19 July
pan-Antarctic
5
23–29 July
Antarctic Peninsula
6
29 July–3 August
East Antarctica
7
20
–30 August
pan-Antarctic
Lessons Learned: WRF Cycling
•
Issue: WRF time step formulation
– WRF adaptive model time step (
dt
) found to result in noise
Time step adjusts
automatically to
get longer when model stability
allows
Permits a longer model time step and thus shorter
forecast wallclock times
– Fix: Constant
dt
specified
•
Issue: Noise early in cycling forecasts
– Digital Filter Initialization (DFI): WRF feature to eliminate
gravity waves at model startup
– Fix: DFI implemented
Lessons Learned: WRF Cycling
• Issue:
Forecast temperature
bias aloft
–
Problem: Significant cold bias seen around 200 mb
–
Fix: Apply spectral nudging
at model upper
levels
in cycling periods
– Nudging source: GFS 3-hr forecasts
– Selected scale nudging applied for:
T, GHT, u, v
• Issue: Model top noise
–
Seen with
WRF option of layer of implicit gravity wave
damping from the AMPS configuration
Purpose: Handle wave reflection from model top
– Fix: Explicit upper diffusion layer option applied
→ O
ption used by Ohio State
Lessons Learned: MRI-4DVAR
•
MRI-4DVAR complicated
: Much time required to
configure/tune system
Thanks to:
Kevin Manning (NCAR)
Anastasiia Chyhareva
(Ukrainian Hydrometeorological Institute and
National Antarctic Science Center)
•
C
ompute hardware issues
: Trial and error testing needed to
determine HPC memory and CPU requirements for 4DVAR
•
Data
issue
: Assimilation of satellite radiance data— 4DVAR crashed
in testing a
pparently
due to inconsistent observation thinning
•
4DVAR may be computationally unaffordable
:
Testing to be done on
new NCAR community HPC this summer
Sounding Assimilation
Testing: TOP 1 (9 May 2022)
– Clear effects of extra soundings
– Differences propagate from modified regions: Wavelike patterns
~500 mb (level 27)
T difference (K)
TOP – STD
Hr 0
0900 UTC 9 May 2022
μ: p
surface
– p
top
difference (hPa)
TOP
– STD H
r 1
1000 UTC 9 May 2022 p
top
=10 mb
Wavelike
difference
patterns
+.5 C
-.5 C
-1.1 C
+.35 C
+.9 mb
-.9 mb
E
x
t
r
a
s
o
u
n
d
i
n
g
L
o
c
a
t
i
o
n
s
:
M
t
.
P
l
e
a
s
a
n
t
,
M
a
r
a
m
b
i
o
,
V
e
r
n
a
d
s
k
y
,
R
o
t
h
e
r
a
T
D
i
f
f
e
r
e
n
c
e
,
H
r
0
T
O
P
–
S
T
D
M
o
d
e
l
C
o
l
u
m
n
P
r
e
s
s
u
r
e
(
μ
)
D
i
f
f
e
r
e
n
c
e
,
H
r
1
T
O
P
–
S
T
D
Sounding Assimilation
Testing: TOP 1 (11 May 2022)
– Signals of e
xtra soundings in East Antarctica seen:
Syowa, Mawson, Davis, Zhongshan, Casey, Dumont d’Urville
μ TOP
–
μ STD
μ (p
surface
– p
top
)
difference (hPa)
TOP
– STD H
r 1
0400 UTC 11 May 2022
0300 UTC 11 May
initialization
E
x
t
r
a
s
o
u
n
d
i
n
g
l
o
c
a
t
i
o
n
s
+.9 mb
-.9 mb
M
o
d
e
l
C
o
l
u
m
n
P
r
e
s
s
u
r
e
(
μ
)
D
i
f
f
e
r
e
n
c
e
,
H
r
1
SUMMARY: Winter YOPP-SH Data Impact Study
• Experiment Status
– Data assimilation setup: Much time put into MRI-4DVAR
configuration and adjustment
– WRF setup: Model configuration tweaking required
Nudging applied (cycling period)
DFI applied
Upper diffusion damping layer implemented
•
Preliminary Results
– Cold bias aloft in WRF cycling period
→ Nudging fix
– Clear differences from soundings
– Difference propagate from sounding locations
– TOP/STD forecast differences become “noisy” by Hr 6
EXPERIMENTS: DATA ASSIMILATION APPROACH 2
2) 3DEnVar: 3-Dimensional Ensemble-Variational DA
– DA method used by WRF in AMPS
– Observations gathered in a time window around the initialization
time (e.g., 3 hrs), but the obs are considered valid at init time
–
Esnemble-Variational method: Uses some
background error (BE)
information from a
(WRF)
forecast ensemble
This study focuses on the impact of enhanced sounding data and new data assimilation methods on Antarctic weather forecasts. Utilizing the Year of Polar Prediction Southern Hemisphere program, researchers aim to improve environmental prediction for the polar regions through targeted observing periods and enhanced observation systems. The study areas include investigating the effects of enhanced sounding datasets on winter forecasts, analyzing forecast impacts of augmented sounding programs, and examining WRF polar cloud simulations using special observations for evaluation of cloud microphysics schemes. The data assimilation experiments involve testing an enhanced sounding dataset and a new data assimilation method for the Antarctic Mesoscale Prediction System. The goal is to enhance microphysics for WRF polar applications by utilizing advanced modeling tools and specialized observation data.

Uploaded on Feb 15, 2025 | 0 Views
Download Presentation

Please find below an Image/Link to download the presentation.
The content on the website is provided AS IS for your information and personal use only. It may not be sold, licensed, or shared on other websites without obtaining consent from the author.If you encounter any issues during the download, it is possible that the publisher has removed the file from their server.
You are allowed to download the files provided on this website for personal or commercial use, subject to the condition that they are used lawfully. All files are the property of their respective owners.
The content on the website is provided AS IS for your information and personal use only. It may not be sold, licensed, or shared on other websites without obtaining consent from the author.
E N D
Presentation Transcript
AMPS WINTER YOPP-SH FORECAST DATA IMPACT STUDY Jordan G. Powers1, Kevin W. Manning1,and David H. Bromwich2 1 Mesoscale and Microscale Meteorology Laboratory National Center for Atmospheric Research Boulder, Colorado, USA 2 Atmospheric Sciences Program and Byrd Polar and Climate Research Center The Ohio State University Columbus, Ohio , USA YOPP-SH Workshop Madison, Wisconsin, USA May 31 June 2, 2023
BACKGROUND WMO Polar Prediction Project (PPP) (2013 2022) Goal: Research to improve environmental prediction for the polar regions YOPP-SH: Year of Polar Prediction Southern Hemisphere Program of the PPP: Observation and prediction in the high southern latitudes YOPP-SH Winter Campaign: April August 2022 Approach: Targeted Observing Periods (TOPs) (1 2 weeks) with enhanced atmospheric observing Cf: YOPP-SH Summer (Nov 2018 Feb 2019) campaign with continuous observation activities
BACKGROUND YOPP-SH Winter Campaign Data (i) Extra radiosonde launches from Antarctic/sub-Antarctic stations (ii) Enhanced observation systems at selected stations (e.g., Micro Rain Radar, Anasphere sonde instruments) Current Ohio State/NCAR Study: Use YOPP Winter Datasets to Improve WRF and AMPS Forecasts for Antarctica Methodology: Model forecast experiments and case simulations Tools: Weather Research and Forecasting (WRF) Model WRF data assimilation (DA) systems YOPP-SH winter sounding and special surface data
OSU/NCAR STUDY AREAS 1) Investigate Effects of Enhanced-Sounding Dataset on AMPS Winter Forecasts (Data Impact Study) Analyze forecast impacts of augmented SH sounding program Assess potential of new DA approach for use in AMPS 2) Examine WRF Polar Cloud Simulations (Ohio State) Apply YOPP-SH special observations for evaluation of WRF cloud simulations by microphysics schemes: Davis, Vernadsky Special measurements: Microwave radar; ceilometer cloud phase; cloud constituent data Aim: Improve microphysics for WRF polar applications
DATA IMPACT STUDY Approach: Data Assimilation Experiments (1) Test enhanced TOP sonde dataset (2) Test new data assimilation (DA) method for AMPS Multi-Resolution Incremental 4DVAR (MRI-4DVAR) Tool: Modified AMPS WRF configuration 24 km 8 km 24-km Southern Ocean grid: Expanded from AMPS 24-km grid to capture more of Australia 8 km 8-km Antarctic grid: Same as AMPS WRF
DATASET EXPERIMENTS Experiment 1 STD: AMPS WRF Standard Observations Surface AWS and station obs Radiosondes Ships and buoys Aircraft reports Satellite winds Satellite radiance measurements GPSRO (radio occultation) measurements Experiment 2 TOP: AMPS Standard Observations + TOP Extra Soundings
YOPP-SH TOP RADIOSONDE SITES YOPP-SH TOP Radiosonde Sites Numbers: X (Y) X= No. extra sondes/day (Y)= No. regular sondes/day Approx. total for TOPS: 1200 Invercargill 2 (2) 2 extra (2 regular)
DATA ASSIMILATION EXPERIMENTS: APPROACH 1 MRI-4DVAR 1) MRI-4DVAR: Multi-Resolution Incremental 4-D Variational DA 4DVAR: Obs assimilated at their actual times withina time window Cf. 3DVAR: Single-time attribution for all obs 6-hr assimilation window 4DVAR: Better analyses and forecasts than 3DVAR, but much more computationally expensive Multi-Resolution Incremental: Two-phased approach using coarser and finer horizontal grid spacings on the assimilation domain in different steps to save cost (i) Calculation of background obs departures: Regular grid spacing used 24 km (ii) Generation of analysis increments (minimization): Coarser grid spacing used 72 km Experiment assimilation domain
DATA ASSIMILATION EXPERIMENTS: APPROACH 2 3DEnVar 2) 3DEnVar: 3-Dimensional Ensemble-Variational DA Used by WRF in AMPS Ensemble-Variational: Process uses background error (BE) information from a (WRF) forecast ensemble 2 BE sources in 3DEnVar: Static and Ensemble (1) BEs derived from previous fcsts: Static BEs (2) BEs derived from current ensemble of fcsts: Ensemble BEs ( flow-dependent errors) WRF forecast preparation path Observations (incl. TOP soundings)
FORECAST EXPERIMENTS WRF Forecasts for TOPs Initializations: 0000 and 1200 UTC for every TOP day Length: 120 hrs 6-hr cycled forecasts with DA performed leading up to each target forecast TOPs 1 2 3 4 5 6 7 Period 9 16 May 2022 2 8 June 1 9 July 14 19 July 23 29 July 29 July 3 August 20 30 August Region of Extra Sondes pan-Antarctic pan-Antarctic East Antarctica Ross Sea pan-Antarctic Antarctic Peninsula East Antarctica pan-Antarctic
Lessons Learned: WRF Cycling Issue: WRF time step formulation WRF adaptive model time step (dt) found to result in noise Adaptive dt: Time step adjusts automatically to get longer when model stability allows Permits a longer model time step and thus shorter forecast wallclock times Fix: Constant dt specified Issue: Noise early in cycling forecasts Digital Filter Initialization (DFI): WRF feature to eliminate gravity waves at model startup Fix: DFI implemented
Lessons Learned: WRF Cycling Issue: Forecast temperature bias aloft Problem: Significant cold bias seen around 200 mb Fix: Apply spectral nudging at model upper levels in cycling periods Nudging source: GFS 3-hr forecasts Selected scale nudging applied for: T, GHT, u, v Issue: Model top noise Seen with WRF option of layer of implicit gravity wave damping from the AMPS configuration Purpose: Handle wave reflection from model top Fix: Explicit upper diffusion layer option applied Option used by Ohio State
Lessons Learned: MRI-4DVAR MRI-4DVAR complicated: Much time required to Thanks to: Kevin Manning (NCAR) configure/tune system Anastasiia Chyhareva (Ukrainian Hydrometeorological Institute and National Antarctic Science Center) Compute hardware issues: Trial and error testing needed to determine HPC memory and CPU requirements for 4DVAR Data issue: Assimilation of satellite radiance data 4DVAR crashed in testing apparently due to inconsistent observation thinning 4DVAR may be computationally unaffordable: Testing to be done on new NCAR community HPC this summer
Sounding Assimilation Testing: TOP 1 (9 May 2022) Clear effects of extra soundings Differences propagate from modified regions: Wavelike patterns Model Column Pressure ( ) Difference, Hr 1 TOP STD T Difference, Hr 0 TOP STD +.9 mb +.5 C Extra sounding Locations: Mt. Pleasant, Marambio, Vernadsky, Rothera +.35 C Wavelike difference patterns -1.1 C -.5 C -.9 mb ~500 mb (level 27) T difference (K) TOP STD Hr 0 0900 UTC 9 May 2022 : psurface ptop difference (hPa) TOP STD Hr 1 1000 UTC 9 May 2022 ptop=10 mb
Sounding Assimilation Testing: TOP 1 (11 May 2022) Signals of extra soundings in East Antarctica seen: Syowa, Mawson, Davis, Zhongshan, Casey, Dumont d Urville Model Column Pressure ( ) Difference, Hr 1 +.9 mb TOP STD (psurface ptop) difference (hPa) Extra sounding locations TOP STD Hr 1 0400 UTC 11 May 2022 0300 UTC 11 May initialization -.9 mb
SUMMARY: Winter YOPP-SH Data Impact Study Experiment Status Data assimilation setup: Much time put into MRI-4DVAR configuration and adjustment WRF setup: Model configuration tweaking required Nudging applied (cycling period) DFI applied Upper diffusion damping layer implemented Preliminary Results Cold bias aloft in WRF cycling period Nudging fix Clear differences from soundings Difference propagate from sounding locations TOP/STD forecast differences become noisy by Hr 6


")
")