Activity Diagrams in Object-Oriented Modeling
I
n
t
e
r
a
c
t
i
o
n
M
o
d
e
l
s
(
2
)
:
A
c
t
i
v
i
t
y
D
i
a
g
r
a
m
s
E
x
t
r
a
c
t
e
d
f
r
o
m
t
e
x
t
b
o
o
k
:
O
b
j
e
c
t
O
r
i
e
n
t
e
d
M
o
d
e
l
i
n
g
a
n
d
D
e
s
i
g
n
w
i
t
h
U
M
L
M
.
B
l
a
h
a
,
J
.
R
u
m
b
a
u
g
h
•
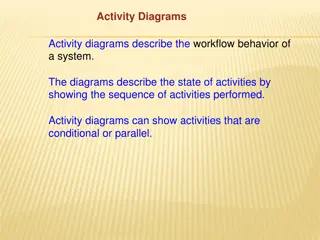
An activity diagram shows the sequence of steps that
make up a complex process such an algorithm or a
workflow.
•
An activity diagram shows flow of control. It is like a
traditional flowchart in that it shows the flow of control
from one step to another step.
•
However, unlike a traditional flowchart, activity diagrams
can show both sequential and concurrent flow of control.
•
Activity diagrams are most useful during the early stages
of designing algorithms and workflows.
A
c
t
i
v
i
t
y
(
1
)
•
The steps of an activity diagrams are operations,
specifically activities from the state model.
•
The purpose of an activity diagram is to show the steps
within a complex activity and the sequencing constraints
among them.
•
Some activities run forever until an outside event
interrupt them.
•
But most activities eventually complete their work and
terminate by themselves. The completion of an activity
indicates that the next activity can be star ted
A
c
t
i
v
i
t
y
(
2
)
•
An activity may be decomposed into finer activities.
•
It is important that the activities on an activity diagram be
at the same level of details (level of abstraction).
B
r
a
n
c
h
e
s
(
1
)
•
If there is more than one successor to an activity, ach
arrow ay be modeled with a condition in square brackets,
for example: [failure]
•
All subsequent conditions are tested when an activity
completes:
–
If one condition is satisfied its arrow indicates the next activity to
perform.
–
If no condition is satisfied, the diagram is badly formed and the
system will hang unless it is interrupted at some higher level
–
If multiple conditions are satisfied , only one successor executes
but no guarantee which one it will be.
B
r
a
n
c
h
e
s
(
2
)
•
A diamond shows a branch into multiple successors but
it means the same thing as arrows leaving an activity
symbol directly:
–
One incoming arrows, two or more outgoing arrows :Decision
node
–
Several incoming arrows, one outgoing arrow: Merge node
I
n
i
t
i
a
t
i
o
n
/
T
e
r
m
i
n
a
t
i
o
n
•
Initiation:
–
A solid circle with an outgoing arrow shows the starting point
of an activity diagram.
–
When an activity diagram is activated , control starts at the solid
circle and proceeds via the outgoing arrow towards the first
activity.
•
Termination:
–
A solid circle surrounded by a hallow circle shows the
termination point.
It only has incoming arrows.
–
When control reaches this symbol, the overall activity is
complete and execution of the activity diagrams ends.
C
o
n
c
u
r
r
e
n
t
A
c
t
i
v
i
t
i
e
s
•
Organizations and computer systems can perform more
than one activity at the same time.
•
Example: one activity may be followed by another
activity then split into several concurrent activities
(a
fork of control), and finally be combined into a single
activity (a merge control)
•
A fork or merge is shown by a synchronization bar:
–
On a synchronization, control must be present on all the
incoming activities, and control passes to all of the outgoing
activities.
Special AD constructs
•
Swimlanes:
–
In a business model it is often useful to know which
human organization is responsible for an activity.
–
Examples: sales, marketing, purchasing, production,
engineering…
–
You can show such a partitioning with an activity
diagram by diving it into columns: Each column is
called a swimlane.
–
Often this kind of AD is called: Role Activity Diagram
Activity diagrams in object-oriented modeling show the sequence of steps in a complex process, such as an algorithm or workflow. They depict the flow of control, including sequential and concurrent paths. These diagrams are essential during the early stages of designing algorithms and workflows, illustrating the steps within a complex activity and their sequencing constraints. Activities can be decomposed into finer tasks, and conditions with branches are also represented to handle different outcomes.

Download Presentation

Please find below an Image/Link to download the presentation.
The content on the website is provided AS IS for your information and personal use only. It may not be sold, licensed, or shared on other websites without obtaining consent from the author.If you encounter any issues during the download, it is possible that the publisher has removed the file from their server.
You are allowed to download the files provided on this website for personal or commercial use, subject to the condition that they are used lawfully. All files are the property of their respective owners.
The content on the website is provided AS IS for your information and personal use only. It may not be sold, licensed, or shared on other websites without obtaining consent from the author.
E N D
Presentation Transcript
Interaction Models (2): Activity Diagrams Extracted from textbook: Object Oriented Modeling and Design with UML M. Blaha, J. Rumbaugh
An activity diagram shows the sequence of steps that make up a complex process such an algorithm or a workflow. An activity diagram shows flow of control. It is like a traditional flowchart in that it shows the flow of control from one step to another step. However, unlike a traditional flowchart, activity diagrams can show both sequential and concurrent flow of control. Activity diagrams are most useful during the early stages of designing algorithms and workflows.
Activity (1) The steps of an activity diagrams are operations, specifically activities from the state model. The purpose of an activity diagram is to show the steps within a complex activity and the sequencing constraints among them. Some activities run forever until an outside event interrupt them. But most activities eventually complete their work and terminate by themselves. The completion of an activity indicates that the next activity can be star ted
Activity (2) An activity may be decomposed into finer activities. It is important that the activities on an activity diagram be at the same level of details (level of abstraction).
Branches (1) If there is more than one successor to an activity, ach arrow ay be modeled with a condition in square brackets, for example: [failure] All subsequent conditions are tested when an activity completes: If one condition is satisfied its arrow indicates the next activity to perform. If no condition is satisfied, the diagram is badly formed and the system will hang unless it is interrupted at some higher level If multiple conditions are satisfied , only one successor executes but no guarantee which one it will be.
Branches (2) A diamond shows a branch into multiple successors but it means the same thing as arrows leaving an activity symbol directly: One incoming arrows, two or more outgoing arrows :Decision node Several incoming arrows, one outgoing arrow: Merge node
Initiation/Termination Initiation: A solid circle with an outgoing arrow shows the starting point of an activity diagram. When an activity diagram is activated , control starts at the solid circle and proceeds via the outgoing arrow towards the first activity. Termination: A solid circle surrounded by a hallow circle shows the termination point. It only has incoming arrows. When control reaches this symbol, the overall activity is complete and execution of the activity diagrams ends.
Concurrent Activities Organizations and computer systems can perform more than one activity at the same time. Example: one activity may be followed by another activity then split into several concurrent activities (a fork of control), and finally be combined into a single activity (a merge control) A fork or merge is shown by a synchronization bar: On a synchronization, control must be present on all the incoming activities, and control passes to all of the outgoing activities.
Special AD constructs Swimlanes: In a business model it is often useful to know which human organization is responsible for an activity. Examples: sales, marketing, purchasing, production, engineering You can show such a partitioning with an activity diagram by diving it into columns: Each column is called a swimlane. Often this kind of AD is called: Role Activity Diagram
:")

")
")
")
")
")