2022/23 Annual Report Presentation to Portfolio Committee on Higher Education
This presentation outlines the financial and non-financial performance of the Department of Higher Education and Training for the year 2022/23. It covers the vision, mission, strategic plan outcomes, achievements against targets, and highlights of accomplishments. The report emphasizes the department's efforts in improving the PSET system, expanding access to opportunities, and ensuring quality provision of education. Key achievements include meeting annual targets, efficient management of disciplinary cases, and receiving a positive audit opinion.
Download Presentation

Please find below an Image/Link to download the presentation.
The content on the website is provided AS IS for your information and personal use only. It may not be sold, licensed, or shared on other websites without obtaining consent from the author.If you encounter any issues during the download, it is possible that the publisher has removed the file from their server.
You are allowed to download the files provided on this website for personal or commercial use, subject to the condition that they are used lawfully. All files are the property of their respective owners.
The content on the website is provided AS IS for your information and personal use only. It may not be sold, licensed, or shared on other websites without obtaining consent from the author.
E N D
Presentation Transcript
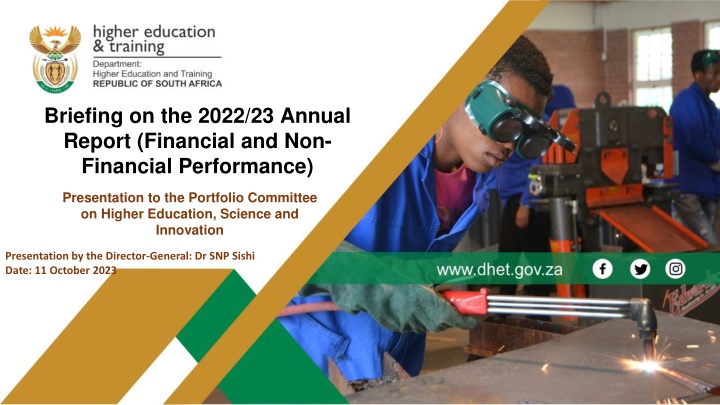
Briefing on the 2022/23 Annual Report (Financial and Non- Financial Performance) Presentation to the Portfolio Committee on Higher Education, Science and Innovation Presentation by the Director-General: Dr SNP Sishi Date: 11 October 2023
Outline of the presentation Vision and Mission Five-year Strategic Plan Outcomes Highlights of Achievements Against Outcomes Programme Performance against Annual Targets Financial Performance
Vision and Mission VISION: An integrated, coordinated and articulated PSET system for improved economic participation, and social development of youth and adults. Development of appropriate steering mechanisms Effective oversight, monitoring and evaluation Department of Higher Education and Training MISSION: To provide strategic leadership to the PSET system through Funding of PSET institutions and entities Provision of support services in relation to teaching and learning
Five-Year Strategic Plan Outcomes Expanded access to PSET opportunities Improved efficiency and success of the PSET system Improved quality of PSET provision A responsive PSET system Excellent business operations within DHET
Achievements Against Targets: 2022/23 35 33 The Department had 111 annual targets. 30 21(64%) 26 25 23 Of the 111 targets, 56 (50%) targets were implemented at institutional level (e.g enrolments, completions etc) 15 (58%) 20 12 (52%) 15 12 5 (42%) 10 10 6 (60%) Overall, 59 (53%) targets were achieved, 52 targets were not achieved. 7 3 (43%) 5 0 52% (27) of the targets not achieved are at institutional level. Programme 1:Administration Programme 2: Planning, Policy and Strategy Programme 3: Univesity Education Programme 4: Technical and Vocational Educatin and Training Targets Achieved Programme 5: Skills Development Porgramme 6: Community Education and Training Annual Targets
Highlights of Achievements Against Outcomes st The Department s Vacancy rate remained below 10% at 9.4% (and improved to 8.8% during the 1 quarter 2023/24) Managed to resolve 80% of disciplinary cases within 90 days as planned Processed payment of 99.7% of valid invoices from creditors within 30 days (and improved to 100% during the first quarter of 2023/24 as all invoices received were processed within 30 days). Received an unqualified audit opinion from the Auditor-General of South Africa - with no findings from on the Department s financial statements.
Highlights of Achievements Against Planned Outcomes Ministerial Enrolment Planning Statement (Universities) for 2023 2025 academic years Reviewed and approved by the Minister Aligned with the strategic priorities of government, Economic Recovery and Reconstruction Plan (ERRP) and institutional capacities (Infrastructure Master Plans of universities). CET Sustainable funding model The sustainable funding model was developed. The model is aligned to funding requirements of a college, such as operations, enrolments, programmes and qualification mix, duration of programmes and lecturers. Standard Operating Procedure and operating manual have been developed to facilitate implementation.
Highlights of Achievements Against Planned Outcomes Student Funding Implementation Framework The report of the Ministerial Task Team (MTT) was submitted during July 2022 and presented to Cabinet during September 2022. By December 2022, the Department had fulfilled and incorporated Cabinet recommendations. The Framework will be tabled at Cabinet by 30 October 2023. Guidelines for the DHET Bursary Scheme The DHET Bursary Guidelines for 2022 were updated and approved by the Minister for implementation during the 2023 academic year at universities and TVET colleges. 556 629 university students received funding from NSFAS. 226 063 TVET college students were supported against planned target of 329 554.
Highlights of Achievements Against Planned Outcomes Placement of TVET graduates in workplaces 10 616 graduates within industry and across government departments. On course to achieving the current target of 20 000 placements placed by 31 March 2024 Implementation of the Skills strategy on Economic Reconstruction and Recovery Programme Implementation of the Strategy ensued during the year under review and is overseen by the SETAs, as well as CET and TVET colleges alongside universities within the PSET System. TVET colleges have identified Occupational Programmes to be introduced and aligned to priority sectors as stipulated in the ERRP.
Highlights of Achievements Against Planned Outcomes Student enrolments and Workplace based learning Enrolments at both TVET (589 083) and CET (143 031) colleges increased in during the year under review 1 068 046 (97%) students were enrolled at universities 99 778 (93%) students were placed in workplace-based learning.
Highlights of Achievements Against Planned Outcomes Implementing the University Capacity Development Programme Filling of New Generations of Academics Programme (nGAP) posts filled at universities: 872 posts are allocated to universities. So far, 772 lecturers have been appointed to the universities on permanent basis. A total of 188 of these lecturers have acquired their PhDs. Allocation of Doctoral scholarships to universities (University Staff Doctoral Programme (USDP): A total number of 324 academics are currently pursuing the PhDs. 40 Academics supported have completed their PhDs and the rest are in progress. Allocation of Master s degree scholarship and internship positions to universities (the Nurturing Emerging Scholars Programme): A total of 193 positions and scholarships have been awarded to universities. A total of 111 positions have been filled.
Highlights of Achievements Against Planned Outcomes Implementing the University Capacity Development Programme..cnt Allocation of development awards to senior academics in universities in support of the Future Professors Programme (FPP): 171 Senior lecturers are participating into a structured programme to develop them towards professorship positions. Currently 114 lecturers are supported in the programme with the rest to be on boarded in 2024/25. All 26 universities are participating in the programme.
Highlights of Achievements Against Planned Outcomes TVET Infrastructure (Completed) The Department continues to improve TVET Infrastructure as part of its attempt to respond to the demands of the National Development Plan. The table below summarizes the new construction at TVET colleges NAME OF FACILITY Mgungundlovu TVET College (Msinga) PROVINCE KwaZulu-Natal KwaZulu-Natal PROGRESS 100% Esayidi TVET College (Umzimkhulu) 100% KwaZulu-Natal Mthashana TVET College (Nongoma) 100% KwaZulu-Natal Mthashana TVET College (Kwagqikazi) 100% KwaZulu- Natal 100% Mfolozi TVET College (Nkandla A) 5
Highlights of Achievements Against Planned Outcomes TVET Infrastructure ( In Planning and Under Construction) NAME OF FACILITY Umgungundlovu TVET College Province Status CAMPUS NAME Greytown (Completion) KwaZulu-Natal Planning (Jan 2024) Bhambanana (Completion) Nkandla B Campus uMfolozi TVET College KwaZulu-Natal Planning (Jan 2024) uMfolozi TVET College KwaZulu-Natal KwaZulu-Natal Planning (Jan 2024) Mnambithi TVET College Berville Campus Planning(April 2024) Under construction (Dec 2024) Mthashana TVET College Vryheid Campus KwaZulu-Natal 5
Highlights of Achievements Against Planned Outcomes Imbali Precinct R182 million was transferred to DUT. The Engineering building is more that 95% complete. The ICT hub project is at planning stage pending the finalisation of consultation. University of Zululand Ulundi Campus The feasibility study to determine administrative and academic sustainability of the campus has been completed. The detailed designs are targeted for completion in March 2024 while construction will commence in the second quarter of 2024. Two new universities - in Ekurhuleni and Hammanskraal Feasibility studies have been completed. A project manager and panel has been established to commence with work around the designs and will be finalised by 31 March 2024. 9
Challenges and Mitigations Challenge Mitigation Progress to date 1. Reliability of performance information from institutional level Strengthen controls around monitoring of projects and collating of supporting evidence. A comprehensive improvement plan to address all areas qualified has been developed Continuous engagements with SETAs, TVET and CET colleges to strengthen the review and data validation processes. Develop an integrated information management system to facilitate improved monitoring and reporting within the portfolio. Elevate integrated planning and streamline processes. Undertook a comprehensive review of the ICT landscape A gap analysis on management systems has been completed An action plan to address the identified gaps is being finalized 2. Lack of integrated planning and implementation Integrated Planning Committee for the PSET system has been established and held its inaugural meeting on 8 September 2023 Consists of Branch Heads, CFO and senior sector representatives, Presidency (NPC, DPME), Independent researchers/consultants). The aim is to reinforce system-wide planning to facilitate cross sectoral alignment Work in progress 3. Lack of alignment and coordination within the PSET system resulting in underachievement Improve planning in both the Department and its entities.
Financial Performance: Part F Financial information presented in the Annual Report (Part F) comprises of the following: The Report of the Accounting Officer The Report of the Audit Committee The Report of the Auditor-General to Parliament Financial Statements (including the Appropriation Statement, Notes to the Appropriation Statement, Statements of Financial Performance, Financial Position and Changes in Net Assets as well as the Cash Flow Statement, Accounting Policies, Notes to the Annual Financial Statements and Supplementary Annexures) The focus on this section is on the following aspects: A brief summary of each report A summary of the Financial Statements The Action Plan to address audit findings and to enhance controls The impact of the 2022/23 financial outcome on Departmental operations
REPORT OF THE ACCOUNTING OFFICER The Report of the Accounting Officer provides a summary of the financial affairs of the Department including an overview of significant events, key policy decisions and spending trends that includes the matters addressed by the relevant Branch Heads on the performance of each Branch. It further includes a narrative pertaining to services, capacity constraints and organisational arrangements alongside corporate governance arrangements endorsed within the Department. The Report of the Accounting Officer is presented from page 196 to 235 of the Annual Report
REPORT OF THE AUDIT COMMITTEE The Report of the Audit Committee expresses the Committee s views on the effectiveness of internal controls within the Department, the quality of in-year and monthly / quarterly reporting in terms of PFMA requirements, the evaluation of financial statements as well as the operations of Internal Audit and Risk Management within the Department. Based on the information contained in the Report, the Audit Committee has expressed its satisfaction with the content and quality of both the interim and annual financial statements. The performance information reporting still require improvement The Committee expressed concerns on the weaknesses in the system of internal control. Concerns were raised on action plans that were not effectively and timely implemented during the year. Concerns were also raised on the organisational structure that is inadequate to support the mandate and responsibilities of the Department. The Audit Committee accepted the conclusions of the Auditor-General on the AFS and were of the opinion that the audited AFS be accepted and read together with the report of the AGSA The detail of the Report of the Audit Committee is presented on page 236 and 237 of the Annual Report.
REPORT OF THE AUDITOR-GENERAL The Report of the Auditor-General is available from page 238 to 247 of the Annual Report. The Department received an unqualified audit opinion regarding its financial statements, without material misstatements. Material findings were, however, identified on the usefulness and reliability of the performance information on the following: Programme 3: Number of university students receiving funding through NSFAS bursaries annually and proportion of university lecturers (permanent instruction or research staff) who hold doctoral degrees Programme 4: Number of TVET students completing NC(V) Level 4 annually; throughput rate of TVET (NC(V)); number of unemployed TVET students placed in workplaces annually; number of Students enrolled in PLP to improve success and Percentage of TVET college lecturing staff appropriately placed in industry or exchange programmes. Programme 5: Number of artisans competent annually; number of learners who completed internships annually; percentage of allocated SETA mandatory grants paid to employers; number of learners who completed learnerships annually and number of learners registered on skills programmes annually Programme 6: Number of students enrolled at CET colleges annually; number of CET students completing GETC: Level 4 annually; percentage of CET colleges compliant with the policy on the conduct and management of examination and assessment annually and percentage of CETCs that meet the standard of good governance No material findings were found on compliance with the specific matters in key legislation set out in the general notice issued in terms of the PAA
Financial Statements: Appropriation Statement The Appropriation Statement provides an indication of the Department s spending against the final Appropriated Funds for the year. In summary, the position is as follows: Final Appropriation: Including: Voted Funds 109 737 633 Direct Charges (Skills Development Levies) 20 808 850 Actual Expenditure: Including: Voted Funds 109 274 717 Direct Charges 20 808 850 Variance (Underspending) The variance is within National Treasury parameters of 8% Detailed Information per Programme and Economic Classification is presented from page 251 to 277 of the Annual Report R 000 130 546 483 130 083 567 462 916(0.35%)
Financial Statements: Appropriation Statement The spending analysis per programme was as follows: Actual Expenditure R 000 Final Variance R 000 Appropriation R 000 STATUS OF EXPENDITURE PER PROGRAMME % Deviation 504 694 452 077 52 617 1: Administration 10.43% 4 695 851 4 683 454 12 397 2: Planning, Policy and Strategy 0.26% 88 834 485 88 818 589 15 896 3: University Education 0.02% 12 647 833 12 282 533 365 300 4: Technical and Vocational Education and Training 2.89% 411 402 406 030 5 372 5: Skills Development 1.31% 2 643 368 2 632 034 11 334 6: Community Education and Training 0.43% 20 808 850 Direct Charges ( Skills Levy to SETAs and NSF) 20 808 850 - 0.00% Total 130 546 483 130 083 567 462 916 0.35%
Financial Statements: Appropriation Statement The spending analysis per economic classification was as follows: Final Actual Expenditure R 000 Status of Expenditure per Economic Classification Appropriation R 000 Variance R 000 % Deviation Compensation of Employees 10 651 217 10 251 820 399 397 3.75% Goods and Services 684 714 634 440 50 274 7.36% Transfer Payments 119 194 110 119 185 791 8 319 0.01% Capital Expenditure 16 442 11 516 4 926 29.96% Total 130 546 483 130 083 567 462 916 0.35%
Reasons for variance per economic classification Economic Classification R 000 Reasons for underspending Natural attrition/Unfilled vacancies/Implementation of Post Provisioning Norms for TVET Colleges not taken place as planned. Compensation of Employees 399 397 Savings on travel and subsistence, printing and stationery due to virtual meetings opposed to physical meetings which is also coupled with monitoring and evaluation processes that was converted to desk-top analysis where possible as well as the cancellation of a stationery tender and CET not claiming interdepartmental examination services rendered and delays in the procurement of blank certificate pager for National Examinations and Assessment. Goods and Services 50 291 Favorable exchange rate for membership fees to the Commonwealth of Learning and over-provision for leave gratuity payouts. Transfers payments 8 319 Capital assts not received as projected due to delays in procurement processes. Capital (Equipment) 4 926 Financial Assets (17) Under-provision for write-offs. Total 462 916
Spending on Top 10 Goods and Services Items Final Actual Expenditure R 000 Appropriation R 000 Variance R 000 % Variance Travel and subsistence 161 190 135 563 25 627 15.90% Computer services 139 411 132 785 6 626 4.75% Operating payments 103 290 99 368 3 922 3.80% Operating leases 88 394 87 321 1 073 1.21% Training and development 43 100 41 469 1 631 3.78% Consultants: Business and advisory services 31 390 29 211 2 179 6.94% Property payments 18 097 17 938 159 0.88% Consumable: Stationery, printing and office supplies 20 151 17 632 2 519 12.50% Audit costs: External 13 141 12 349 792 6.03% Venues and facilities 12 195 10 975 1 220 10.00%
2022/23: Transfers and Subsidies R 000 46 352 812 Institution/Entity Universities Public Entities National Student Financial Aid Scheme (NSFAS) Council on Higher Education (CHE) South African Qualifications Authority (SAQA) Quality Council for Trades and Occupations (QCTO) Public Services SETA Education and Training Practices SETA National Skills Fund: Demand Led Skills Training Higher Health National Institute for Humanities and Social Sciences TVET Colleges Subsidies CET College Subsidies Foreign Governments and International Organisations Leave Gratuity Total 45 794 967 74 486 81 164 28 506 123 972 21 338 100 000 20 604 39 709 5 490 918 215 151 3 250 29 860 98 376 737
Financial Statements: Irregular Expenditure No irregular expenditure was incurred during the financial year. A summary of the movement in Irregular Expenditure during the financial year is reflected under Part E and according to the summary closing balance for Irregular Expenditure for the 2022/23 financial year amounts to R1.065 million (Page 188) The detail of the amount of R1.065 million is as follows: 2022/23 R 000 Opening Balance (from previous years) 6 972 Less: Irregular Expenditure condoned (956) Less: Irregular Expenditure not condoned and removed (4 951) Closing balance 1 065
Progress on the Irregular Expenditure cases reported in the previous years: (2020/21) (R1.065 m) 2020/21 FY Amount (R 000) 1 065 Status Item incurred 2020/21 1 Incorrect procurement procedure followed for the procurement of goods and services for tooling and training materials in support of the World Skills International Competition in Kazan (R723 518.00; R149 500.00 and R191 806.39) Submission National Treasury to condone the Irregular Expenditure. was made to
Financial Statements: Fruitless and Wasteful Expenditure R89 000.00 Fruitless and Wasteful Expenditure was incurred during the financial year. A summary of the movement in Fruitless and Wasteful Expenditure during the financial year is reflected under Part E and according to the summary closing balance for Fruitless and Wasteful Expenditure for the 2022/23 financial year amounts to R0.089 million (Page 190) The detail of the amount of R0.089 million is as follows: 2022/23 R 000 Opening Balance (from previous years) - Fruitless and Wasteful Expenditure that relates to 2016/17 and identified in 2022/23 30 Fruitless and Wasteful Expenditure that relates to 2020/21 and identified in 2022/23 59 Closing balance 89
ACTION PLAN TO IMPROVE AUDIT FINDINGS Each Branch completed an audit action plan in September 2023 to address the control deficiencies based on the audit findings. These plans address the areas raised in the Audit Report in conjunction with all other matters identified during the audit resulting in audit queries. Progress will be monitored and reports will be submitted on a regular basis to the Minister, the Director-General and the Audit Committee. All the actions to be completed by 31 January 2024.
ACTION PLAN TO IMPROVE AUDIT FINDINGS The level of spending did not have a negative impact on the operations of the Department. Measures were put in place to prevent overspending and material underspending of the Vote. The outcome of expenditure within the current economic pressures could place additional pressures on the Department for the 2023/24 reporting period, but all possible measures are being implemented to prevent it. Significant pressure is still experienced to manage the additional responsibilities and functions for the TVET and CET sectors.
