Challenges and Opportunities in U.S.-Japan Trade Relations
Explore the challenges and opportunities in U.S.-Japan trade relations through a brief history, global trade statistics, current account comparisons, and merchandise exports data. Highlights include NAFTA upgrade, CP-TPP, investment stocks in Japan and the United States, and potential cooperation in various sectors.

Download Presentation

Please find below an Image/Link to download the presentation.
The content on the website is provided AS IS for your information and personal use only. It may not be sold, licensed, or shared on other websites without obtaining consent from the author. Download presentation by click this link. If you encounter any issues during the download, it is possible that the publisher has removed the file from their server.
E N D
Presentation Transcript
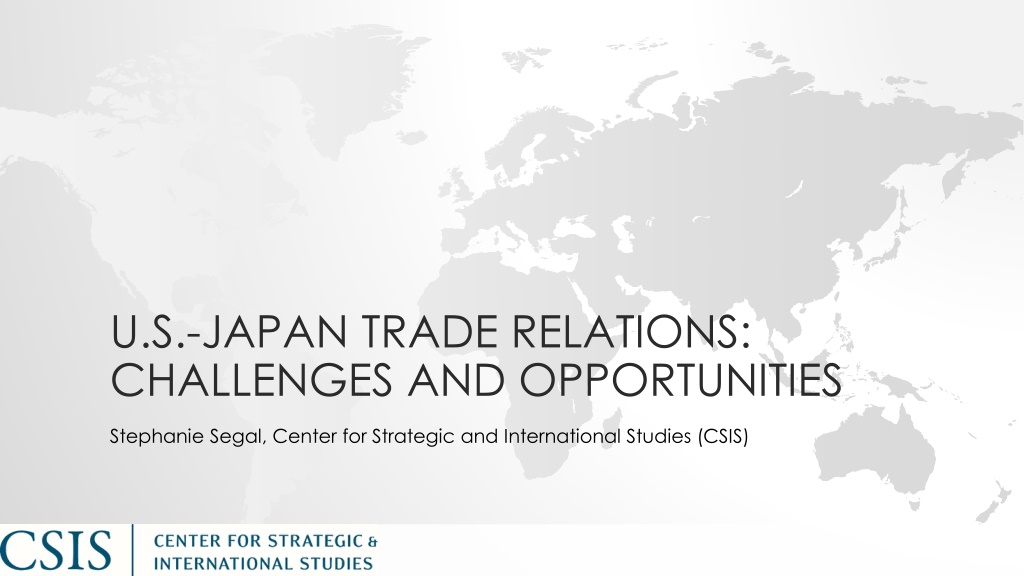
U.S.-JAPAN TRADE RELATIONS: CHALLENGES AND OPPORTUNITIES Stephanie Segal, Center for Strategic and International Studies (CSIS)
CONTEXT A (very) brief history Global developments Politics of trade Challenges and opportunities 2
GLOBAL TRADE (GOODS AND SERVICES) PERCENT OF GLOBAL GDP 70.0 60.0 50.0 40.0 30.0 20.0 10.0 SOURCE: IMF WORLD ECONOMIC OUTLOOK DATABASE, OCTOBER 2017 3
CONTRIBUTION TO GLOBAL GDP 100% 90% 80% 70% 60% 50% 40% 30% 48% 46% 38% 20% 10% 0% 2000 2008 2017E US Japan China ROW SOURCE: IMF WORLD ECONOMIC OUTLOOK DATABASE, OCTOBER 2017 4
CURRENT ACCOUNT COMPARISON PERCENT OF COUNTRY S GDP 10.0 8.0 6.0 4.0 2.0 0.0 2008 2009 2010 2011 2012 2013 2014 2015 2016 2017E 2018F 2019F 2020F 2021F 2022F -2.0 -4.0 -6.0 US Japan China SOURCE: IMF WORLD ECONOMIC OUTLOOK DATABASE, OCTOBER 2017 5
MERCHANDISE EXPORTS, 2016 USD BILLIONS 1600 1452 (7.8 percent of US GDP) 1400 1200 1000 800 (13.0 percent of Japan GDP) 643 600 497 400 151 148 130 200 63 19 0 Total exports Bilateral to China to Mexico, Canada United States Japan SOURCE: IMF WORLD ECONOMIC OUTLOOK DATABASE, OCTOBER 2017 6
CHALLENGES AND OPPORTUNITIES NAFTA upgrade CP-TPP TPP Take 2 ( TPP-TT )? Cooperation Investment Standards Infrastructure 7
INVESTMENT STOCKS: JAPAN Inward FDI ($191bn, 4% GDP) Outward FDI ($1,315bn, 27% GDP) ROW EU United Kingdom Cayman Islands United States Singapore Switzerland China (Mainland + HK) ROW EU United Kingdom Thailand United States Singapore Australia China (Mainland & HK) SOURCE: IMF COORDINATED DIRECT INVESTMENT SURVEY (CDIS), 2016YE 8
INVESTMENT STOCKS: UNITED STATES Inward FDI ($3,725bn, 20% GDP) Outward FDI ($5,332bn, 29% GDP) ROW EU Canada Cayman Islands Japan United Kingdom Switzerland Australia ROW EU Canada Cayman Islands Japan United Kingdom Switzerland Bermuda SOURCE: IMF COORDINATED DIRECT INVESTMENT SURVEY (CDIS), 2016YE 9
US-JAPAN ECONOMIC DIALOGUE Pillar I: Trade and Investment Enforcement Bilateral issues Macro Fin Reg Development Pillar II: Economic and Structural Pillar III: Sectoral Cooperation Infrastructure Energy Digital Economy 10
THANK YOU Stephanie Segal, Senior Fellow and Deputy Director, William E. Simon Chair in Political Economy CSIS | Center for Strategic and International Studies 1616 Rhode Island Ave. NW, Washington DC, 20036 ssegal@csis.org Office: (202) 775-3150 Mobile (202) 276-4040 11


")